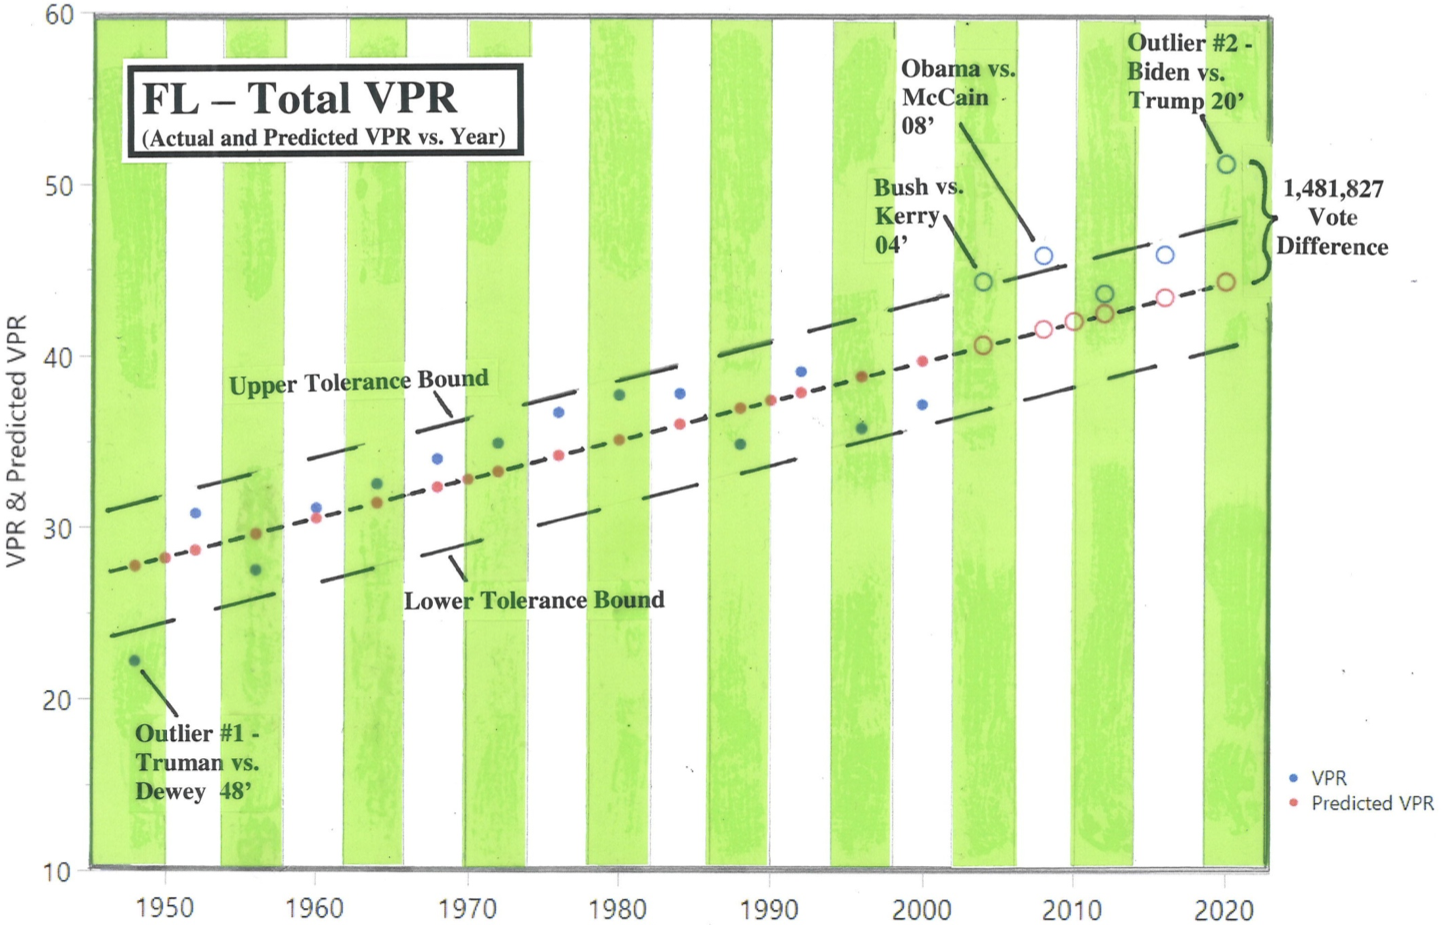

The data used for calculating both the VPR and the Predicted VPR, based on Official U.S. Government data, can be found below. From 2000 to 2020, the number of ballots cast in Florida increased by 85.60%, but the population during this same period increased by only 34.76% – a 2.5 Times increase in ballots versus population.
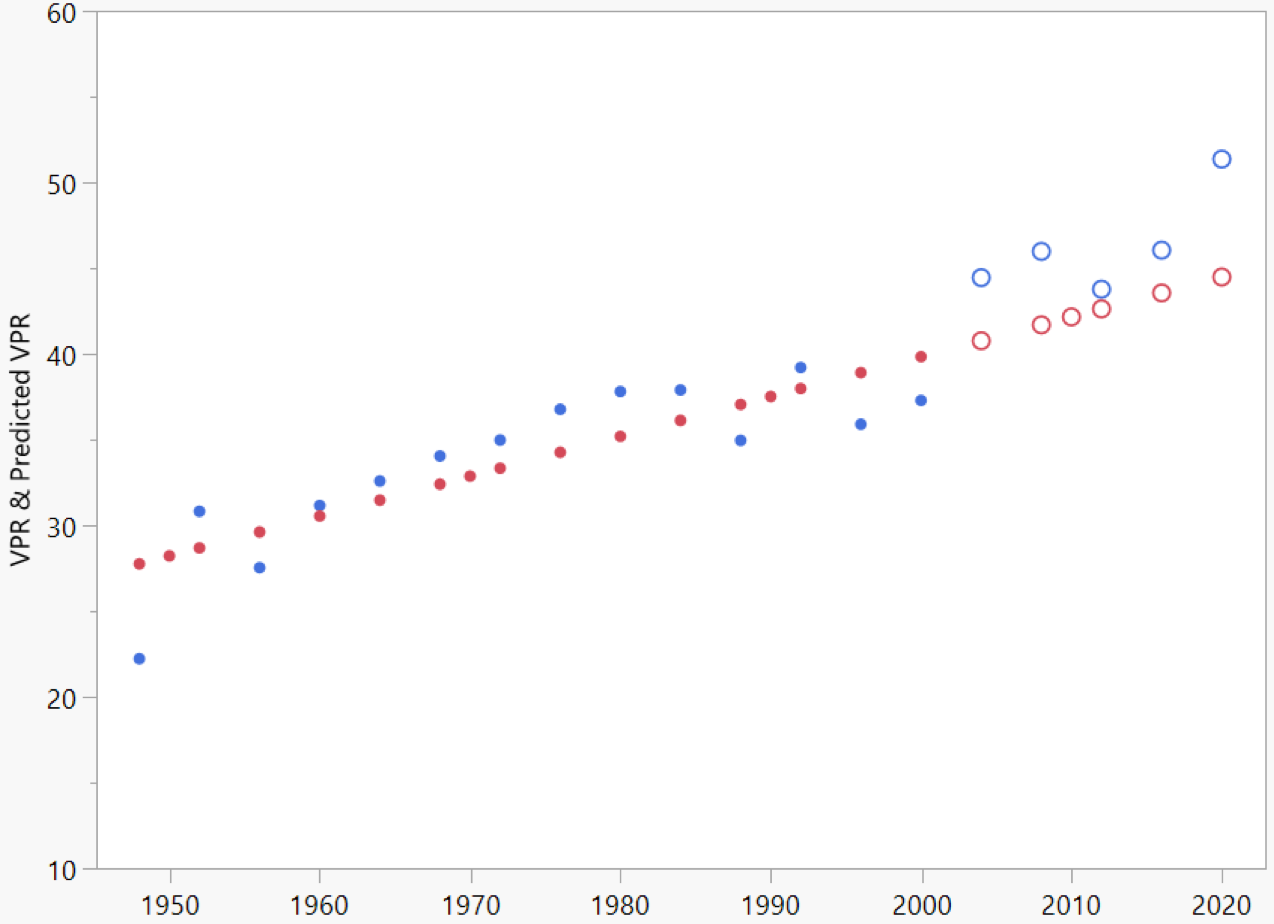
A positive incline trend for the total VPR. Most election results fall within the Tolerance Bounds up through the year of 2004.
Outlier #1 is the result of a lackluster campaign in 1948 with low turnout by both of the two major parties. Moving forward to 2000, how could anyone forget what happened in the state of Florida that year – with the results ending basically in a tie (and with the hanging “chads”). The Total VPR, however, in that election was below the trend line by a noticeable amount. In 2004, the data point is along the Upper Tolerance Bound; this is most likely the result of the strong level (above trend line) of support by both of the individual political parties. In 2008, the data point for Total VPR is just outside the Upper Tolerance Bound (a marginal Outlier). With the election of the “First Black President,” this, in part, explains the higher than normal level of voting by the population for this cycle; but Obama’s support began to wane by the next election cycle. Outlier #2 for Total VPR happened in 2020 with the race between Biden and Trump, being the result of both political parties having noticeable positive deviations from their individual party trend line. Considering the unusually high level of voting by both political parties, it might be usual that there was no “offsetting vote” from one party VPR to the other. Note the Vote Difference for the Total VPR of 1,481,827 votes.
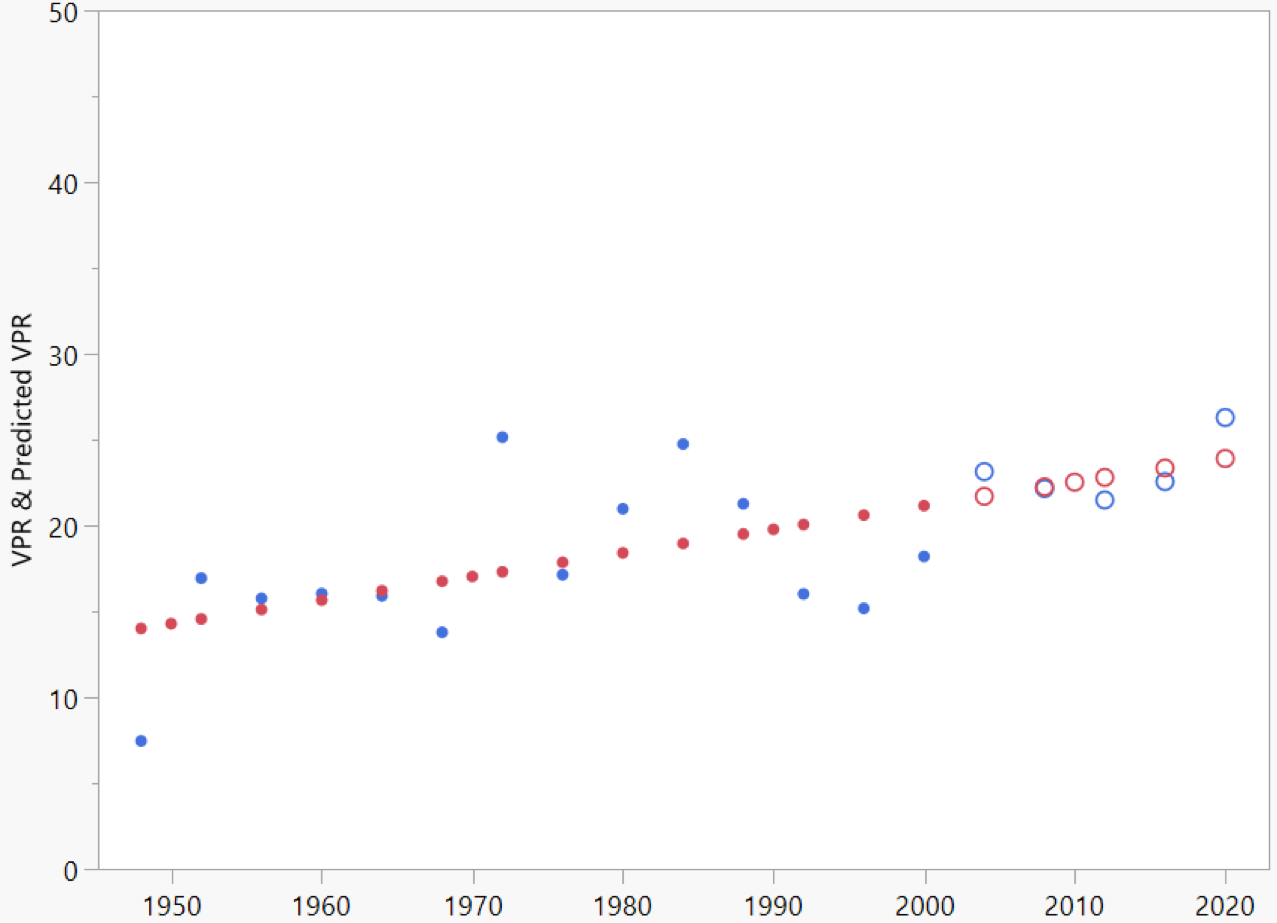
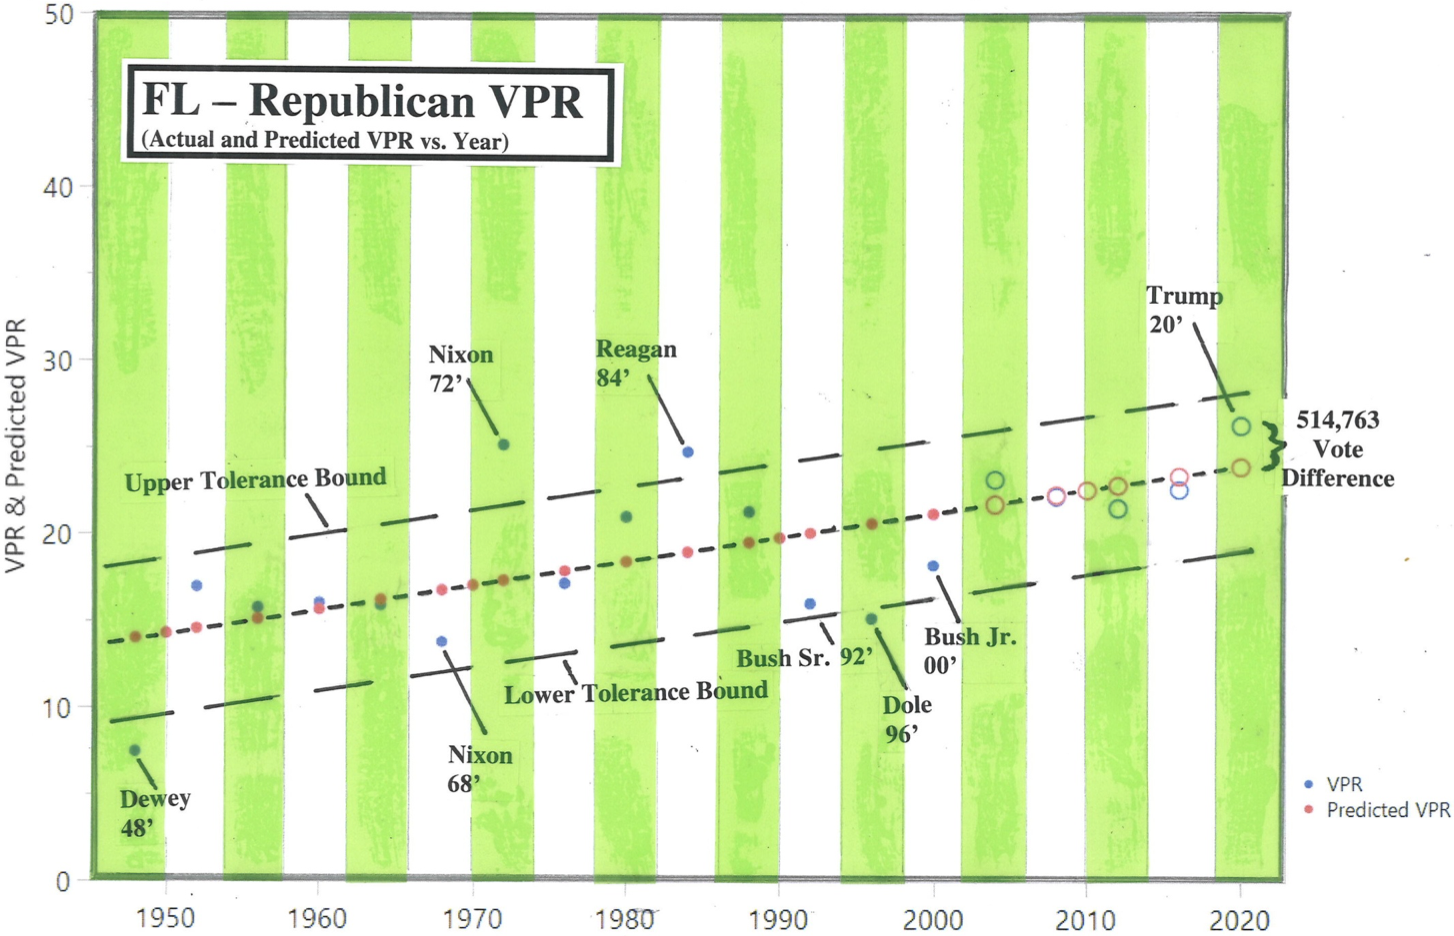
The long-term trend for both the Republicans and Democrats is about the same, with both having an (positive) incline.
As for individual cycles and starting in 1968, we see the individual parties were both below the trend line of their party VPR; this was mostly the result of the major 3rd party candidacy of George Wallace taking votes away from the two major parties. In 1972, Nixon was above the Upper Tolerance Bound (being an Outlier in fact) for the Republicans, with an offsetting below the Tolerance Bound by McGovern. In 1976, Carter did exceptionally well; and with Florida being adjacent to Georgia, this was likely the reason. In 1984, Reagan was above the Tolerance Bound (being a positive Outlier) for the Republicans, with an offsetting below the trend by the Democrats. We see this “offsetting” move again in 1988 with the Republicans above the trend and the Democrats performing poorly with Dukakis. In 2000, both individual parties performed below their trend lines, but Bush was more off his party trend than Gore for the state of Florida. In 2008, Obama performed well – at the Upper Tolerance Bound in the Sunshine state, with McCain being right on his party trend line. In 2020, both Biden and Trump performed significantly above their individual party long-term trend; some might find this slightly unusual.
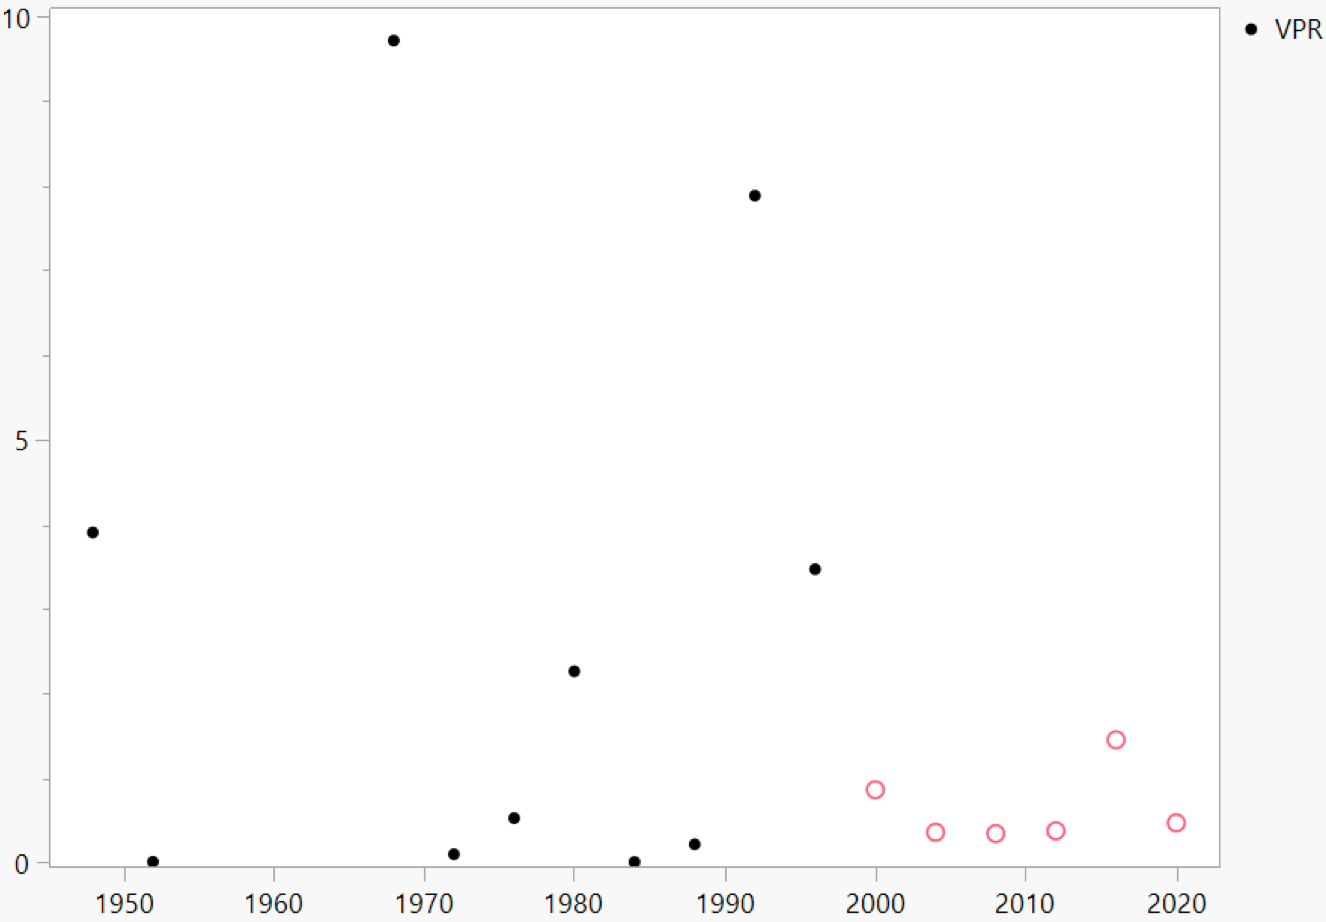
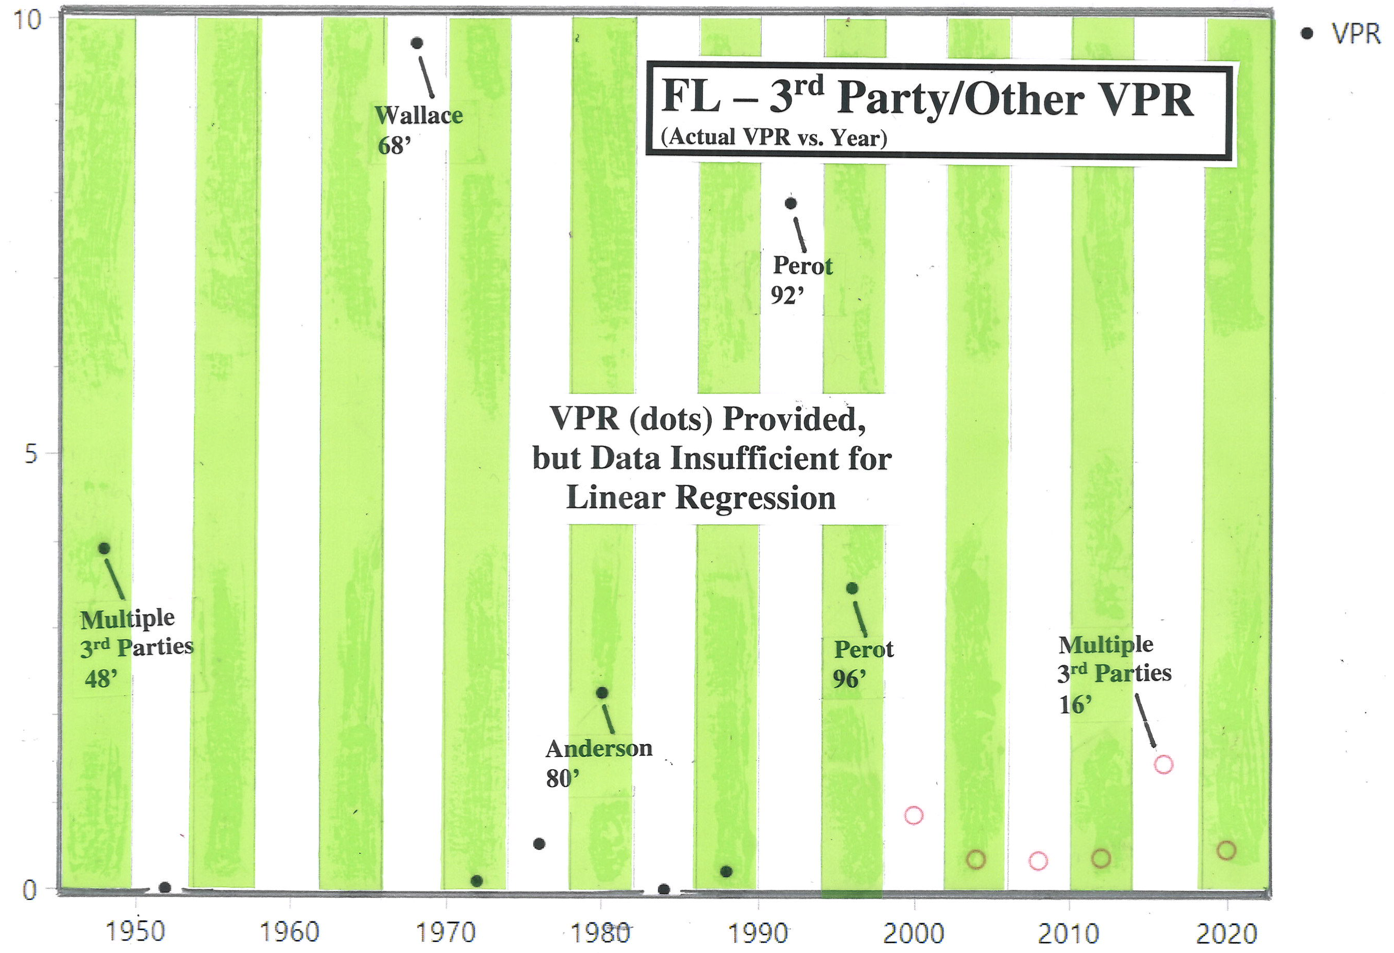
Very often this category of votes represents 1% or less, close to zero, of the total population. But in cycles where there is greater than a 1% showing, it generally creates havoc for the two major parties at the national level – with the election being “thrown” from one party to the other.
In 1968 for the state of Florida, George Wallace’s support was nearly equal to the Democrats – helping Nixon to win the state. Ross Perot had a strong showing in 1992, almost costing a win for the Republicans in Florida. Perot’s support in 1996 was less than half of what it was before but still pulled enough votes away from the Republicans to help Bill Clinton win the state.
Because the 3rd Party vote is usually at or very close to zero (with the exception of 1948, 1968, 1992, 1996, and 2016), the Data for this section is Insufficient for Linear Regression Analysis.