The data used for calculating both the VPR and the Predicted VPR, based on Official U.S. Government data, can be found below. From 2004 to 2020, the number of ballots cast in Arizona increased by 68.3%, but the population during this same period increased by only 26.97% (2004 was used for the base year, because 2000 was such an anomaly in Arizona) – a 2.5 Times increase in ballots versus population.
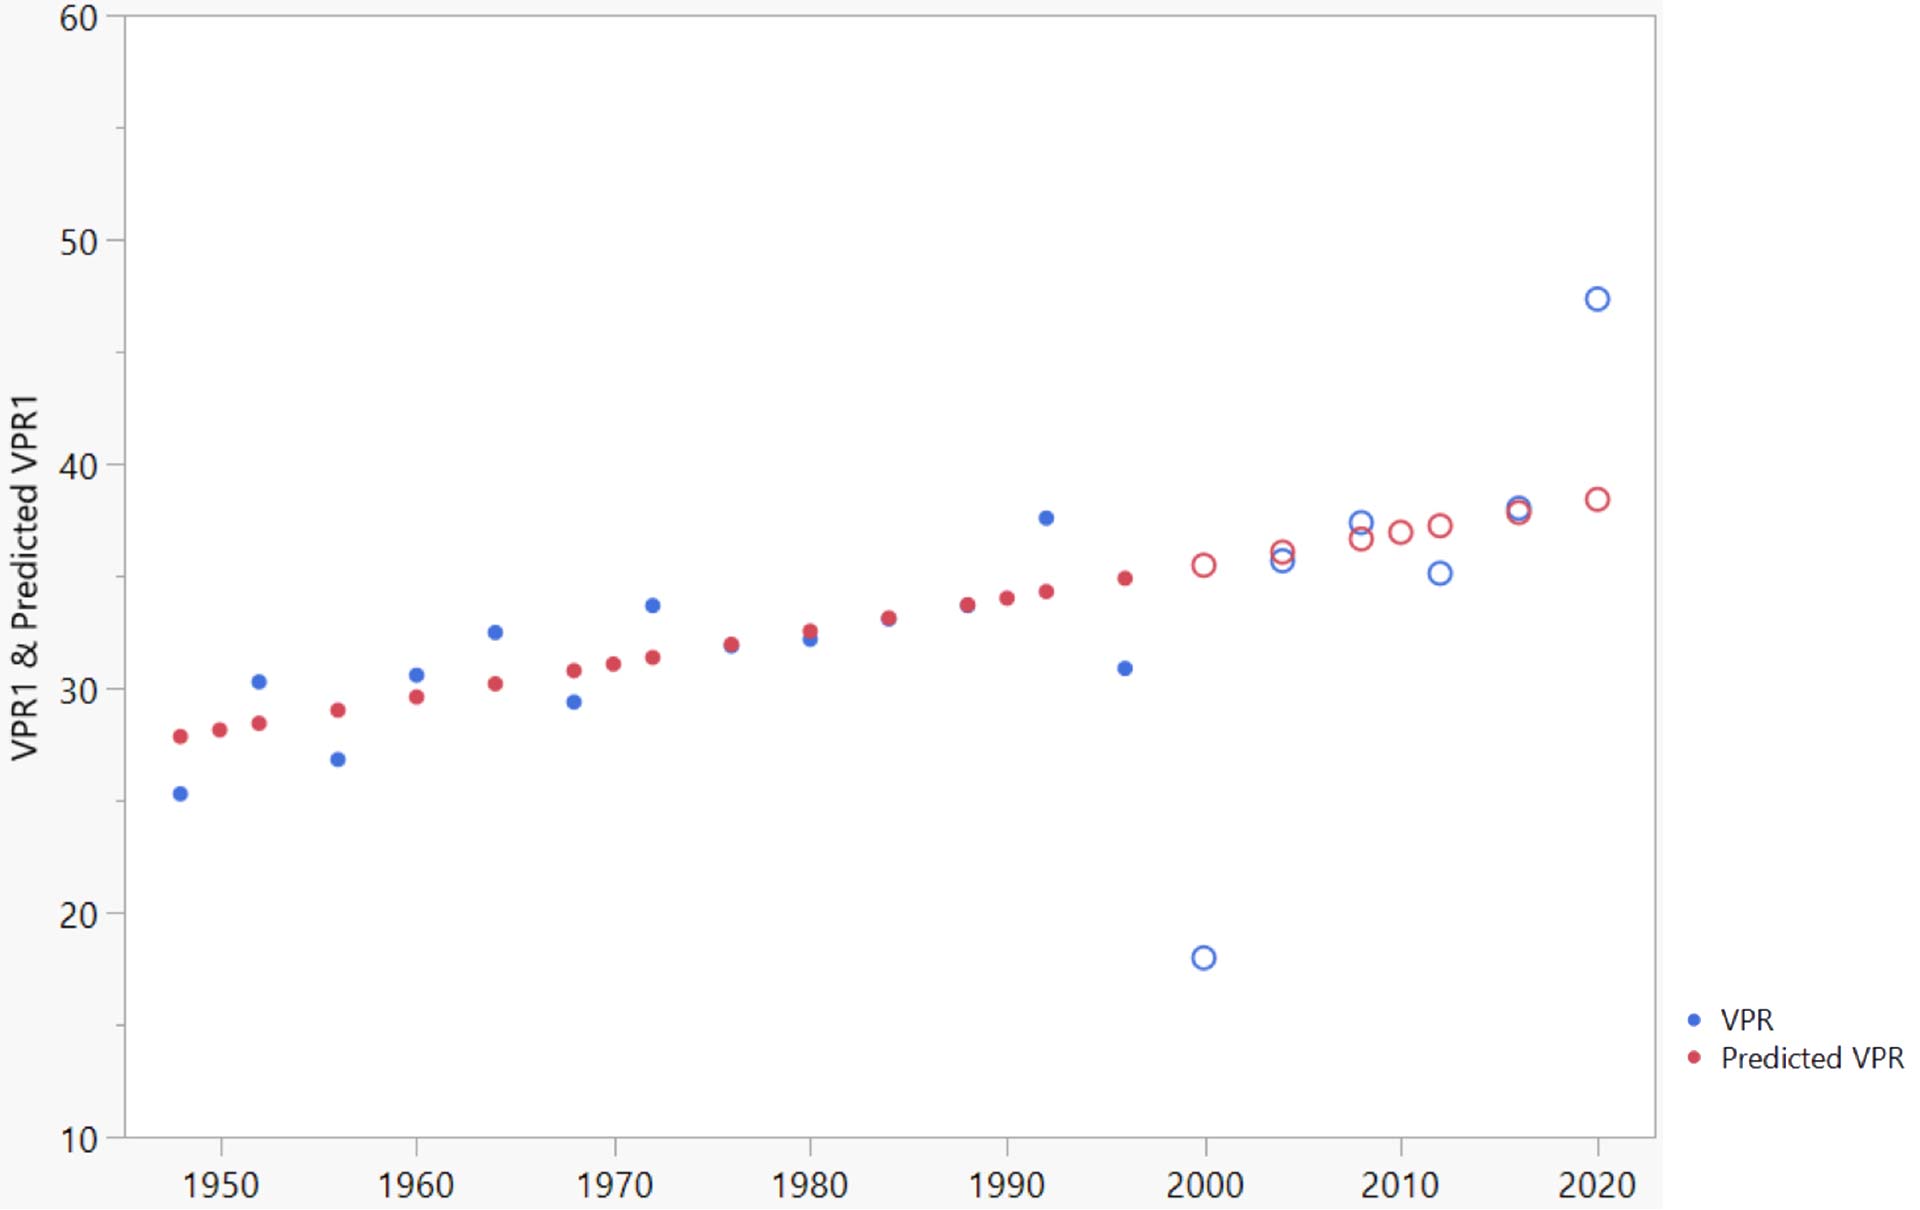
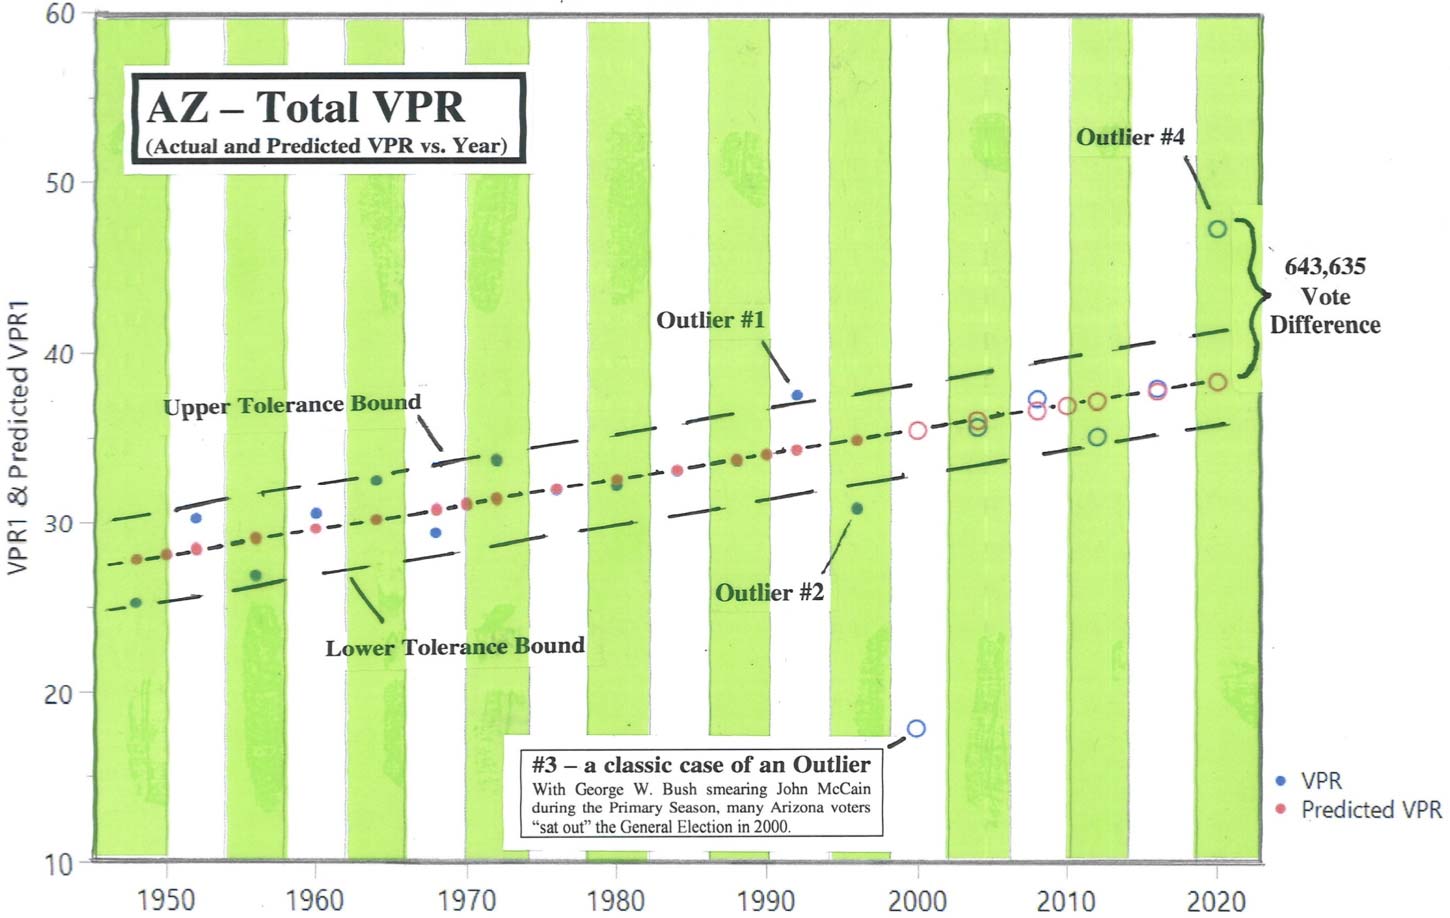
A positive incline trend for the total VPR. The election results of nearly all cycles fall close to or within the Tolerance Bounds, with the exception being 2000 and 2020.
Outlier #1 – the election cycle of 1992, involved an above average voter participation, mainly the result of the 3 rd party candidacy of Ross Perot. Likewise, the (negative) Outlier #2 in 1996 can be explained by the waning support of Perot and the lackluster campaign of Dole, the Republican candidate. Outlier #3 is a classic example of an Outlier. With George W. Bush smearing Arizona’s “Favorite Son” – John McCain during the Primary Season, many Arizona voters “sat out” the General Election in 2000. There is, however, little explanation for such a larger outlier (Outlier #4) of 2020. This opens the door for the possibility of nefarious activities by one or both of the two political parties as an explanation. Also note the rather large “Out-of-Line” or “Vote Difference” number of 643,634 involving the Total VPR.
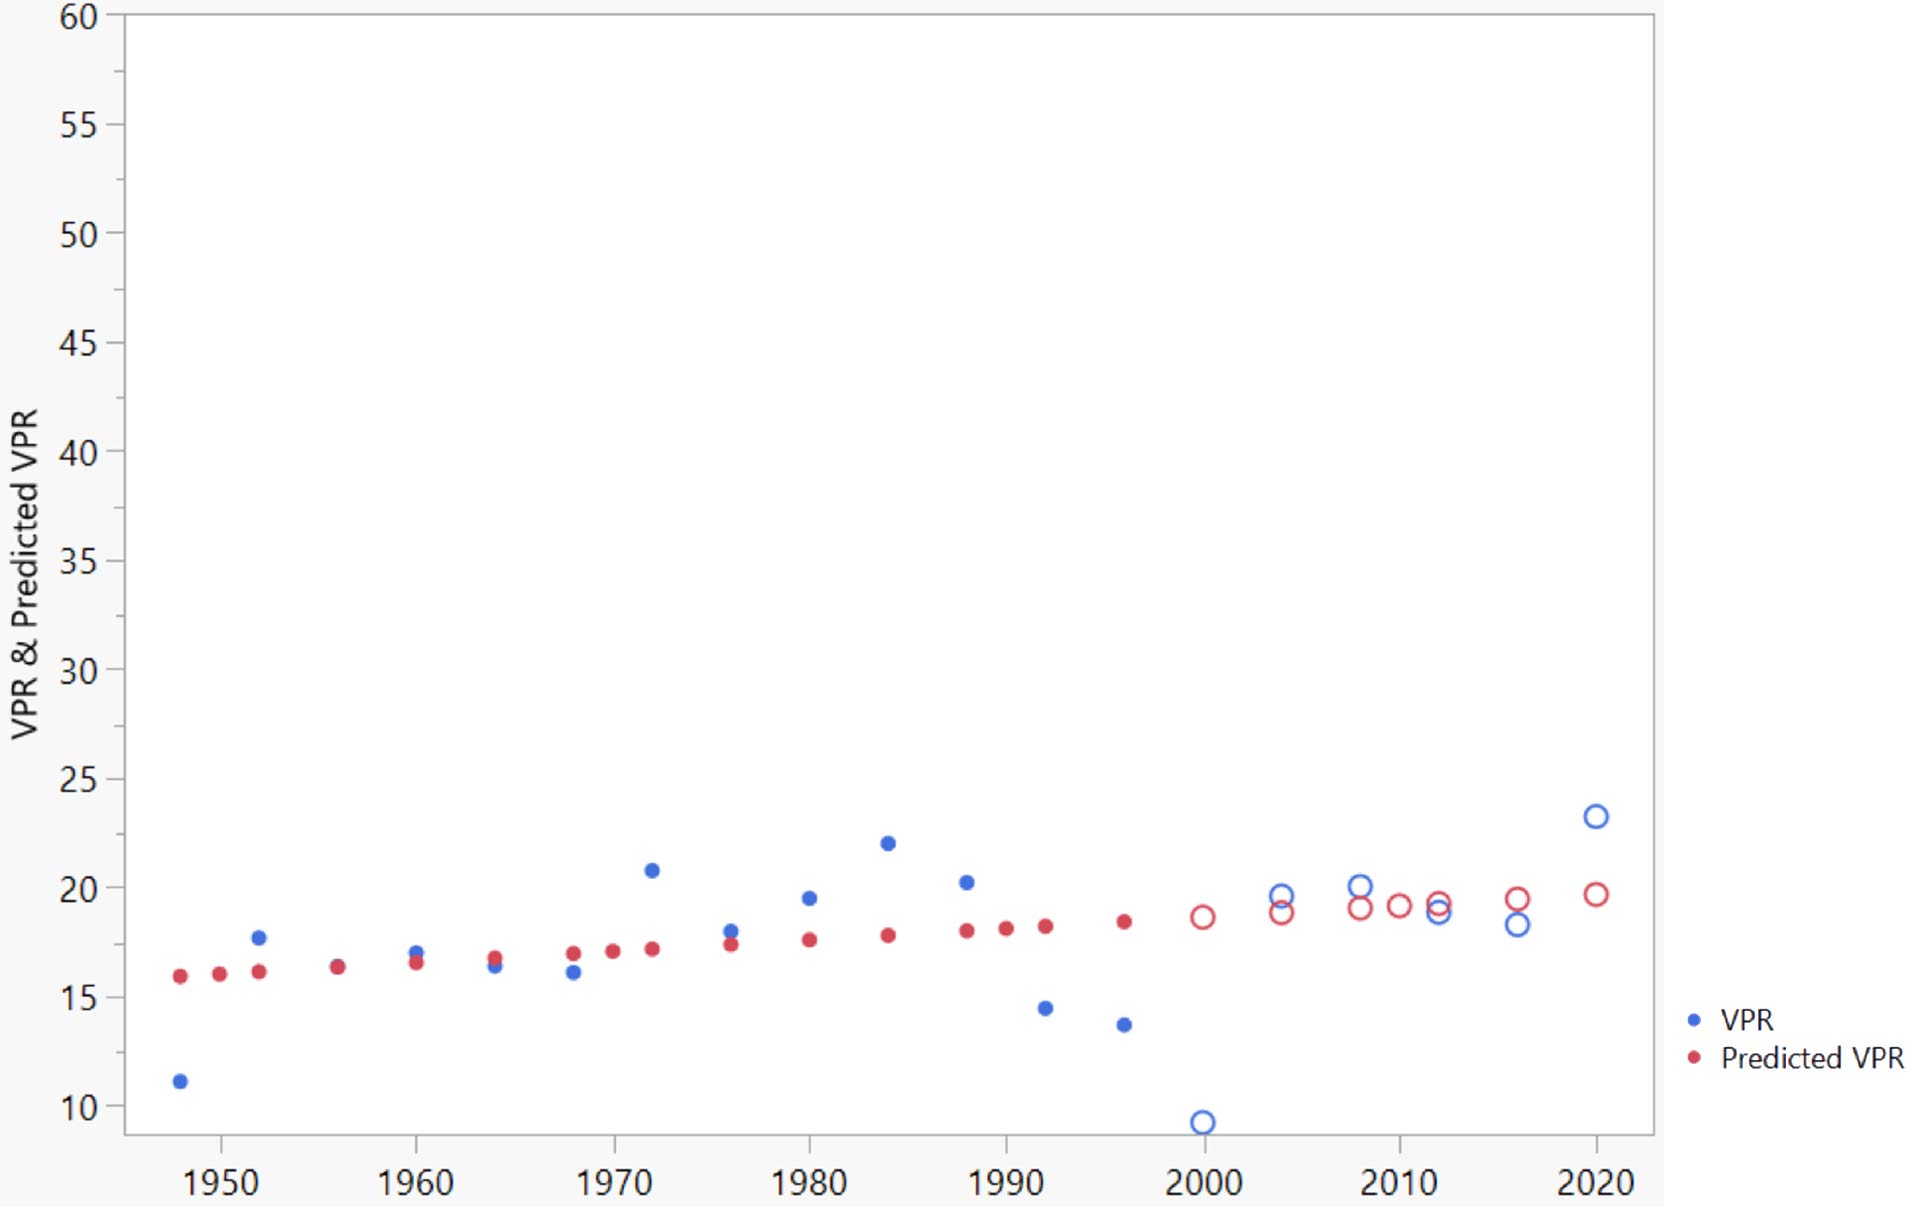
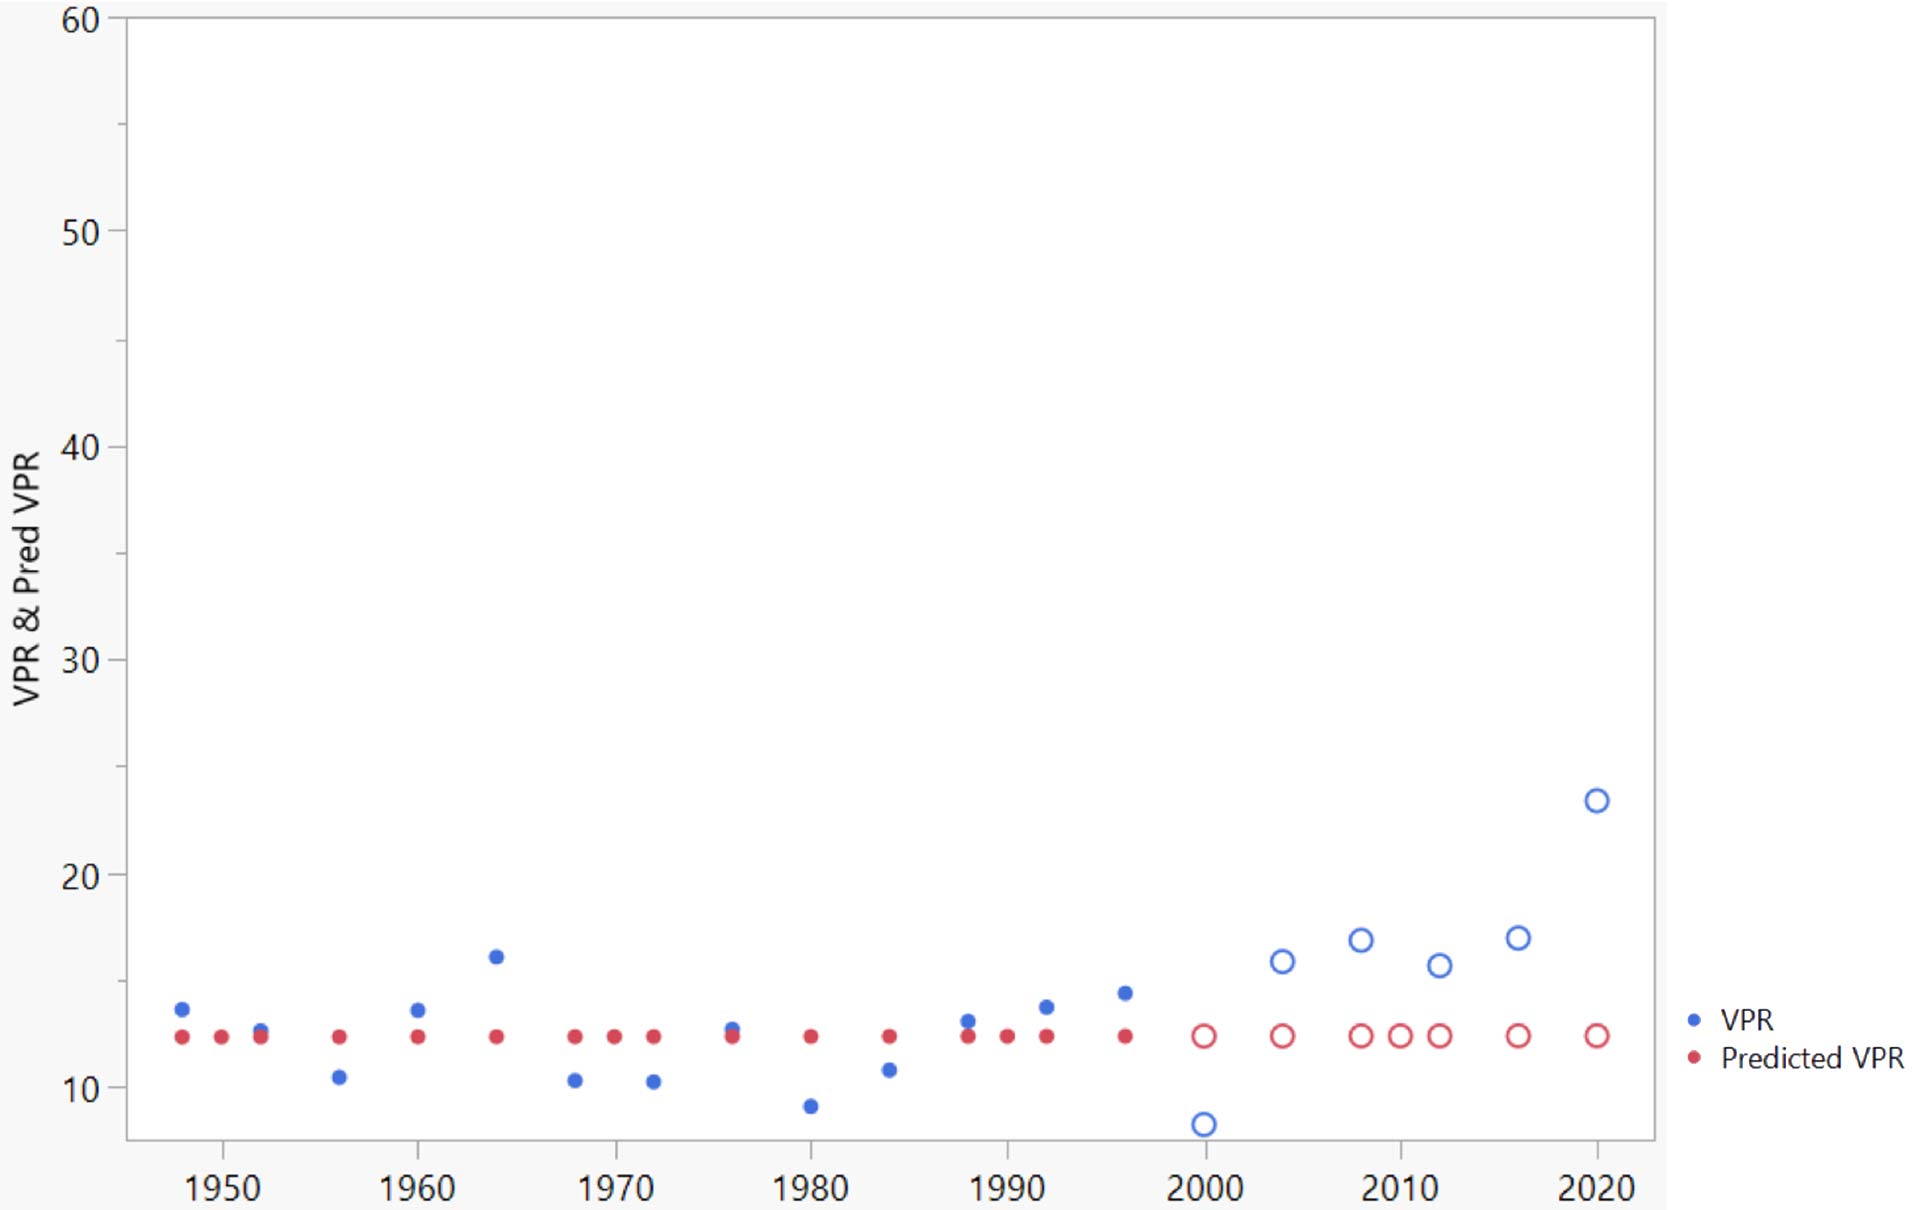
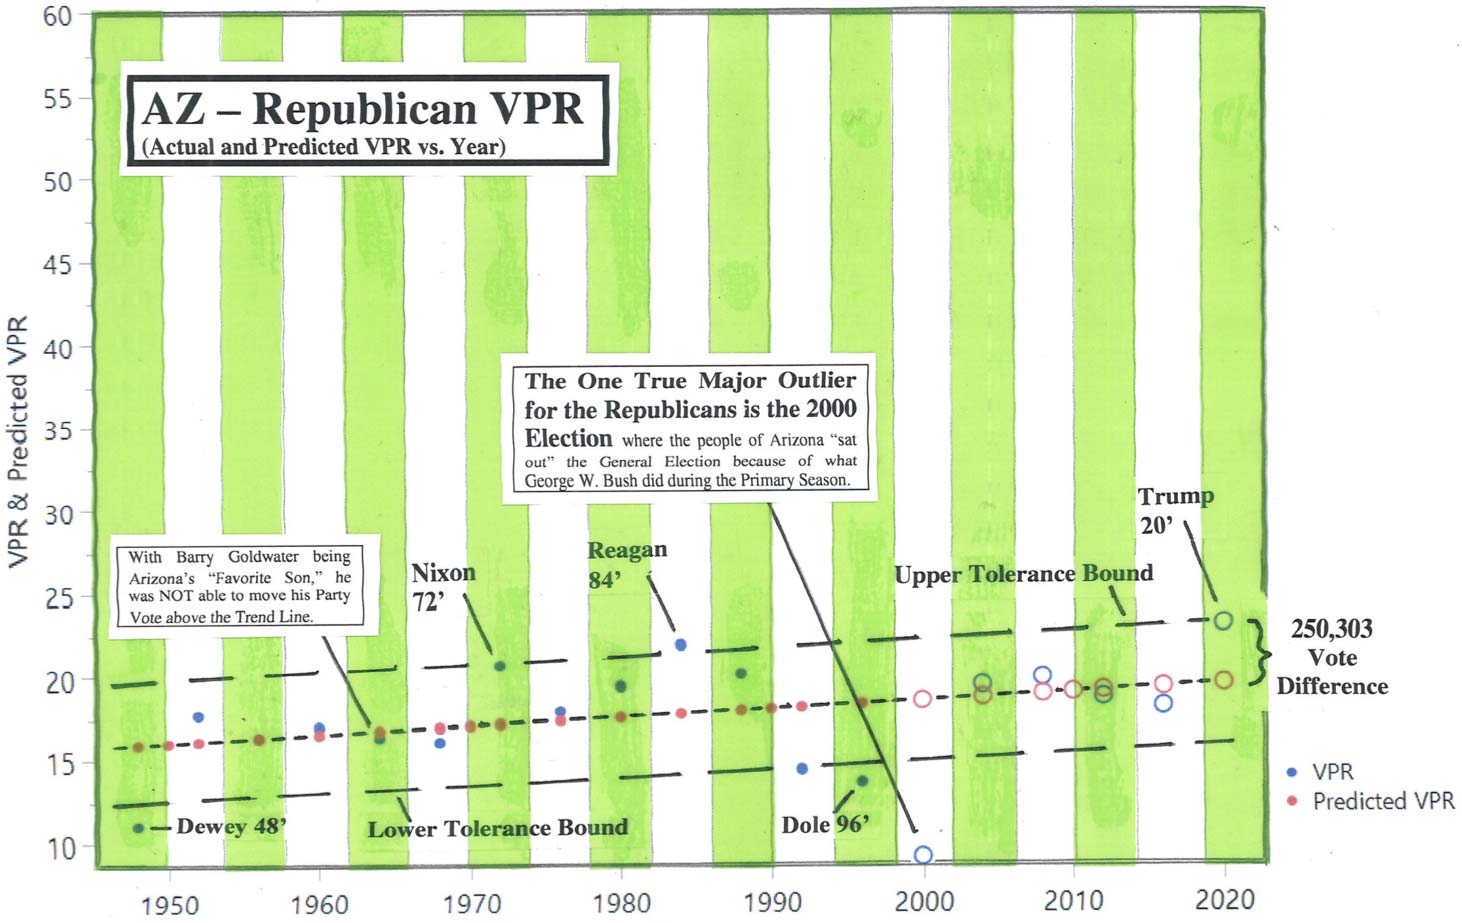
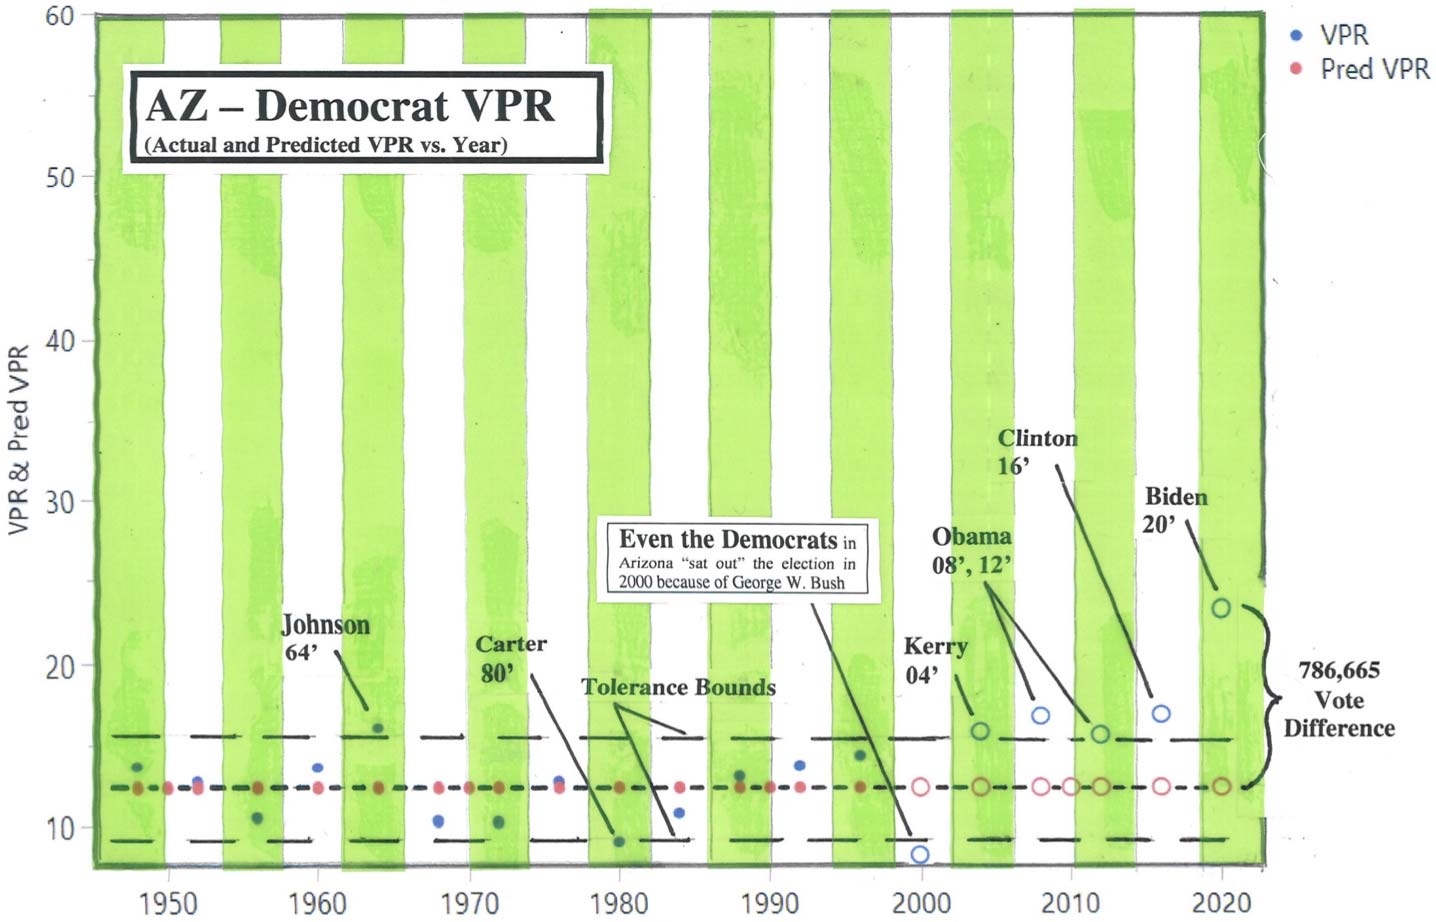
The long-term for the Republicans has been positive; but it is slightly negative for the Democrats, except for an upturn breakout starting in 2004.
As for individual cycles, the Republicans performed poorly in 1948, which was considered generally a lackluster campaign. Both LBJ in 1964 and Nixon in 1972 performed well (at or outside the Tolerance Bound) with their respective parties. By 1980, there was little support for Carter in Arizona; and by 1984, there was overwhelming support for Reagan’s re-election. Dole was below the Tolerance Bound for 1992; this can be explained by Perot taking votes away from the Republicans and the lackluster support for Dole. The 2000 cycle was a negative outlier for both the Republicans and Democrats – this was the reactions by the people of Arizona for what happened to John McCain during the Primary Season. The Democrats trended at or slightly above their Tolerance Bound for the cycles of 04, 08, 12, and 16. But there is little explanation for the huge outlier of Joe Biden in 2020, with a party “Vote Difference,” off the trend line, of 786,665 votes – a real mystery for the gap to be that great.
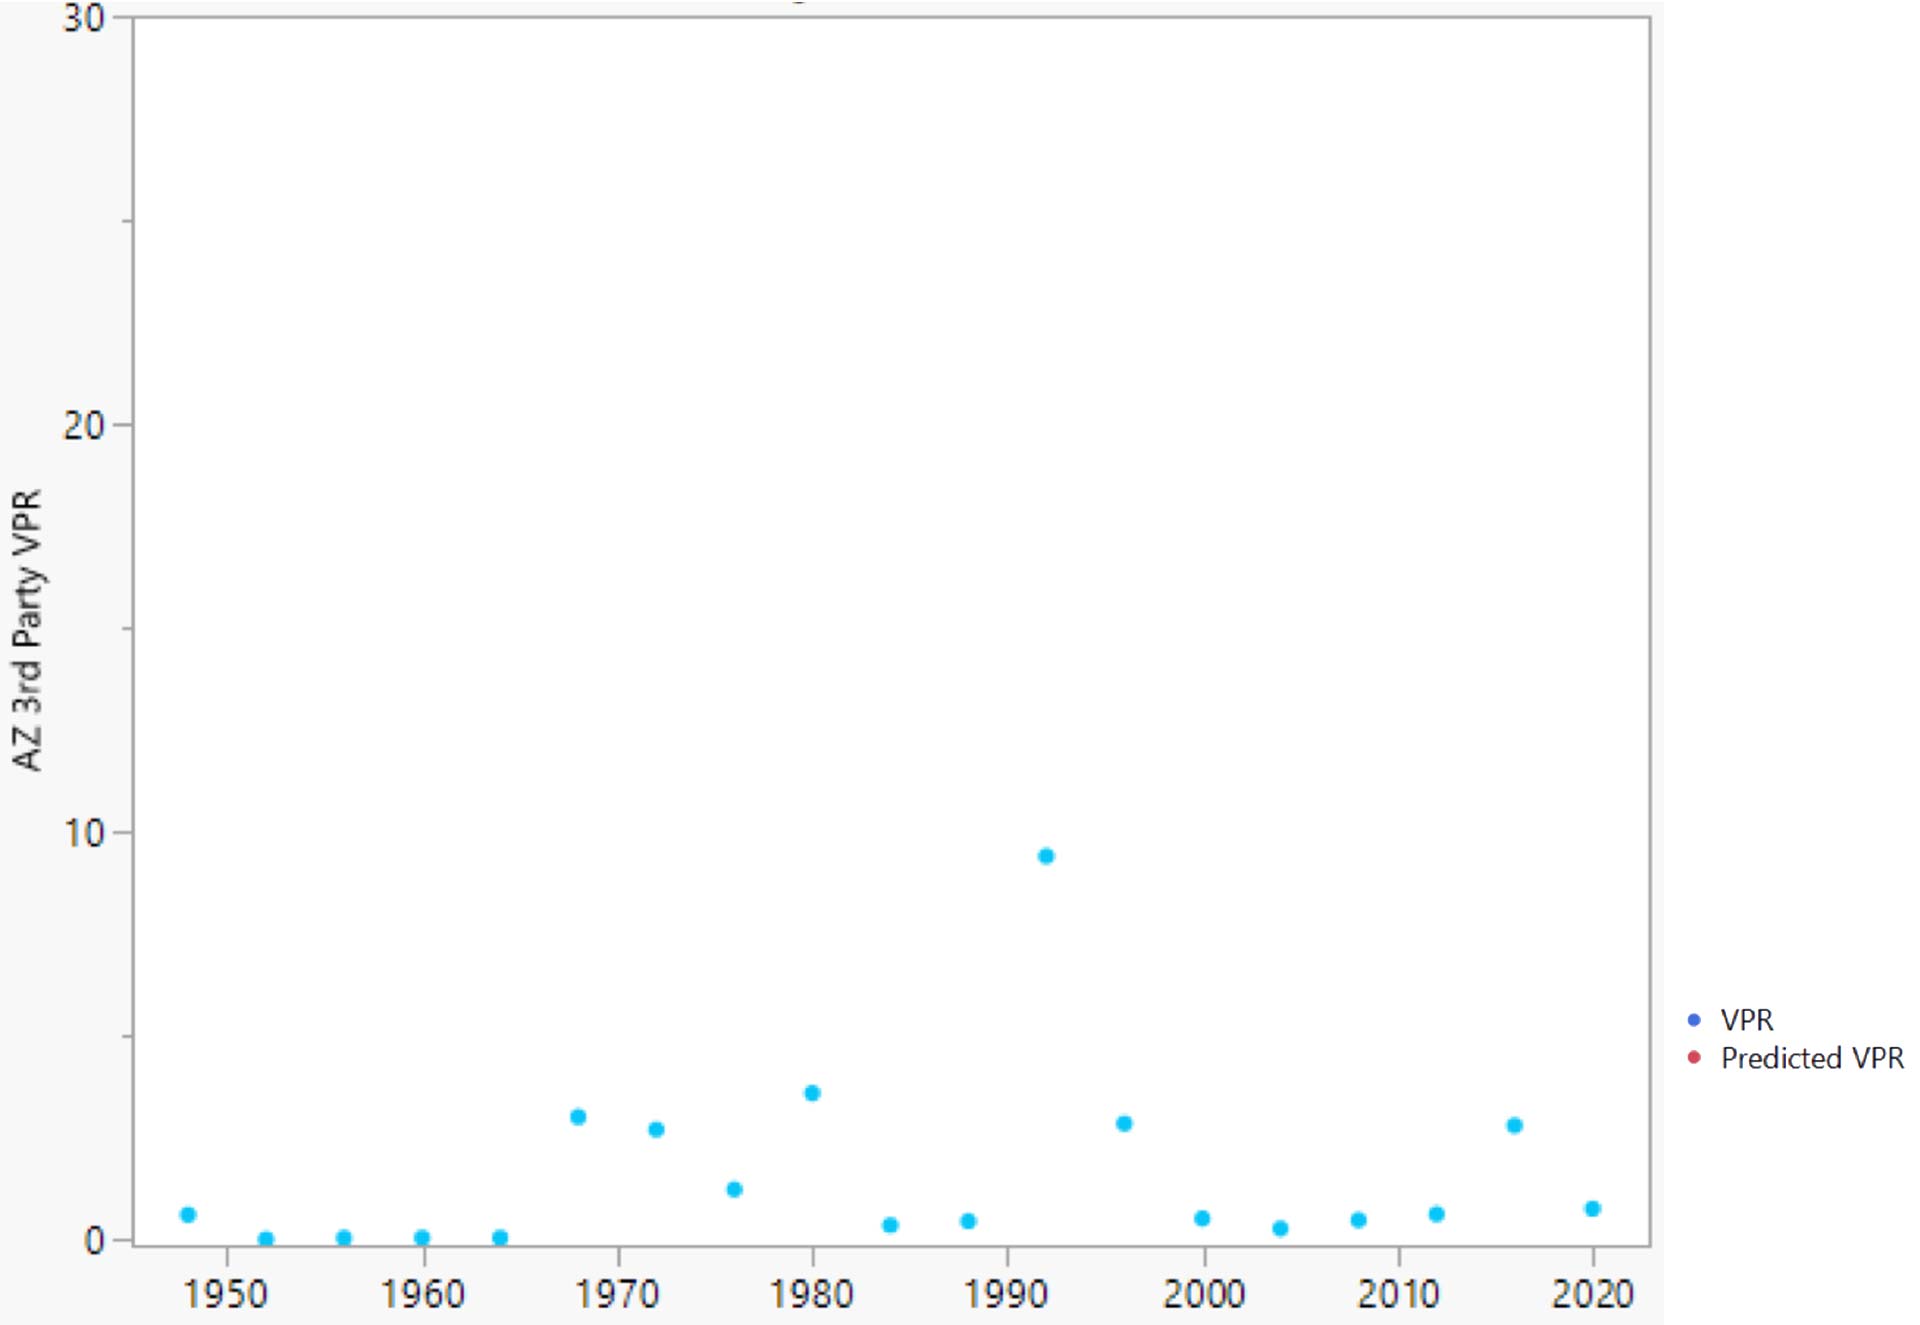
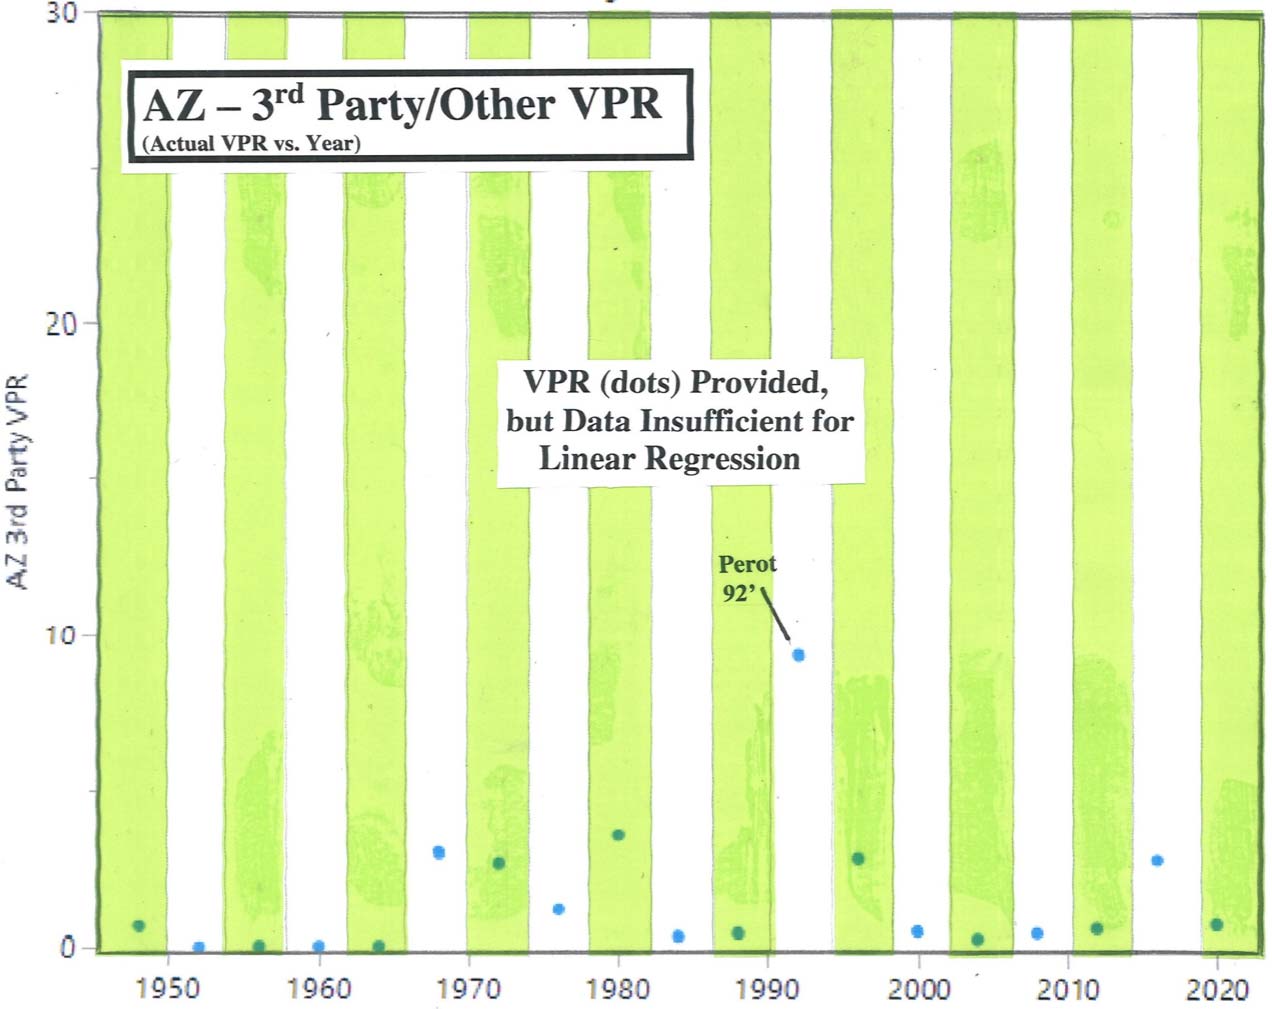
Very often this category of votes represents 1% or less, close to zero, of the total population. But in Arizona, there were 5 cycles where it represented around 3% of the population. And in 1992, Perot received 9.4% support of the total population in Arizona. Sometimes this 3 rd party vote can create havoc for a mainly two-party system on a national level, where one wins the popular vote and the other wins the Electoral College.
Because the 3 rd Party vote is at or very close to zero for many of the cycles, the Data for this section is Insufficient for Linear Regression Analysis.