The data used for calculating both the VPR and the Predicted VPR, based on Official U.S. Government data, can be found below. From 2000 to 2020, the number of ballots cast in North Carolina has increased by 89.8%, but the population during this same period increased by only 29.7% – a 3.0 Times increase in ballots versus Population.
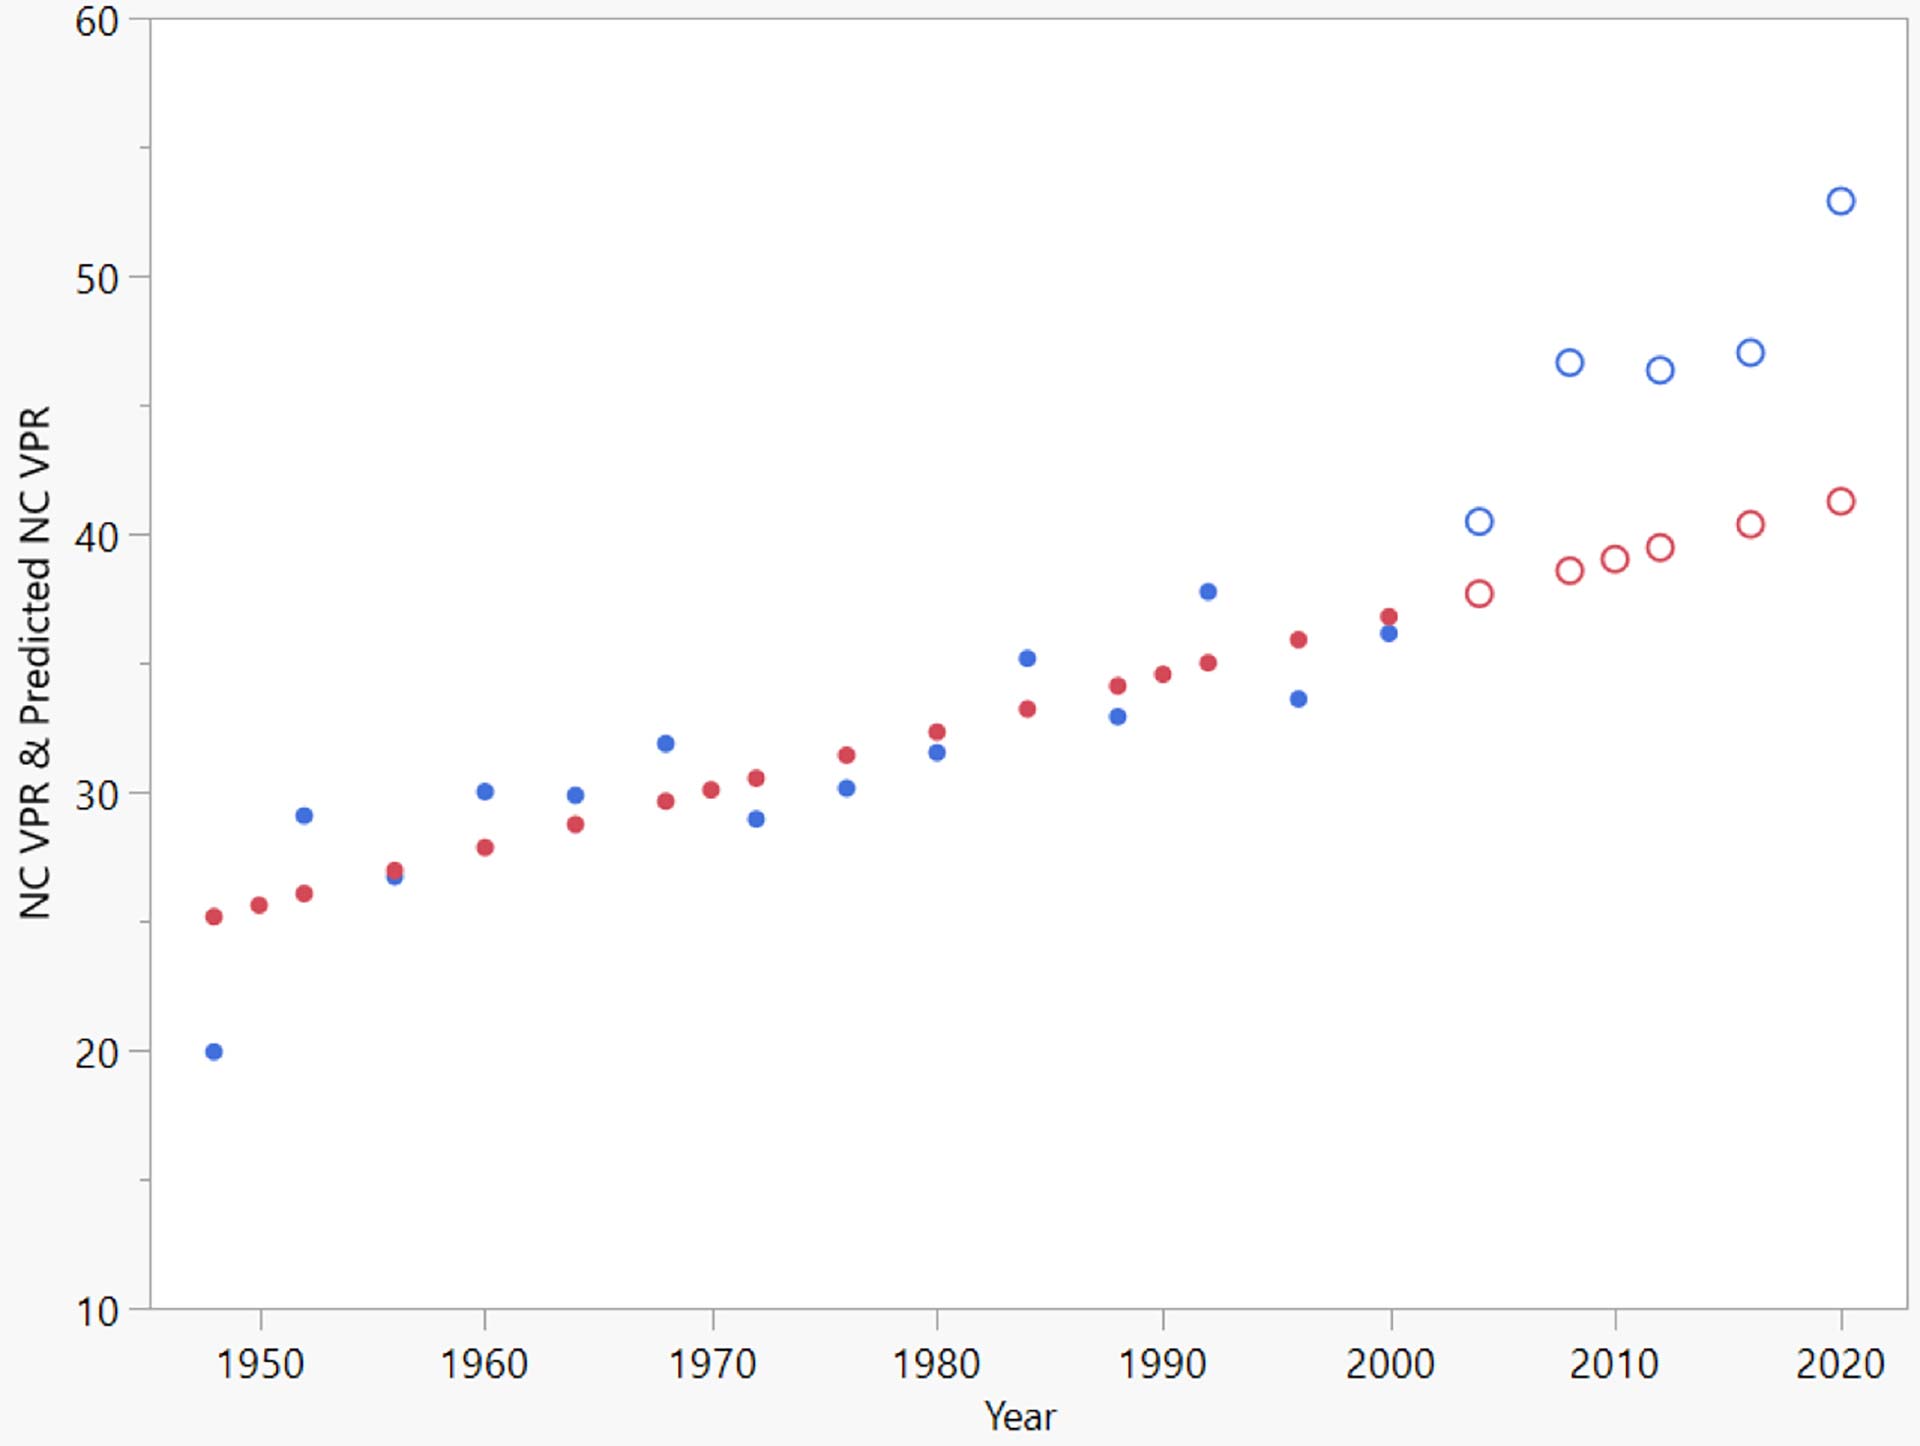
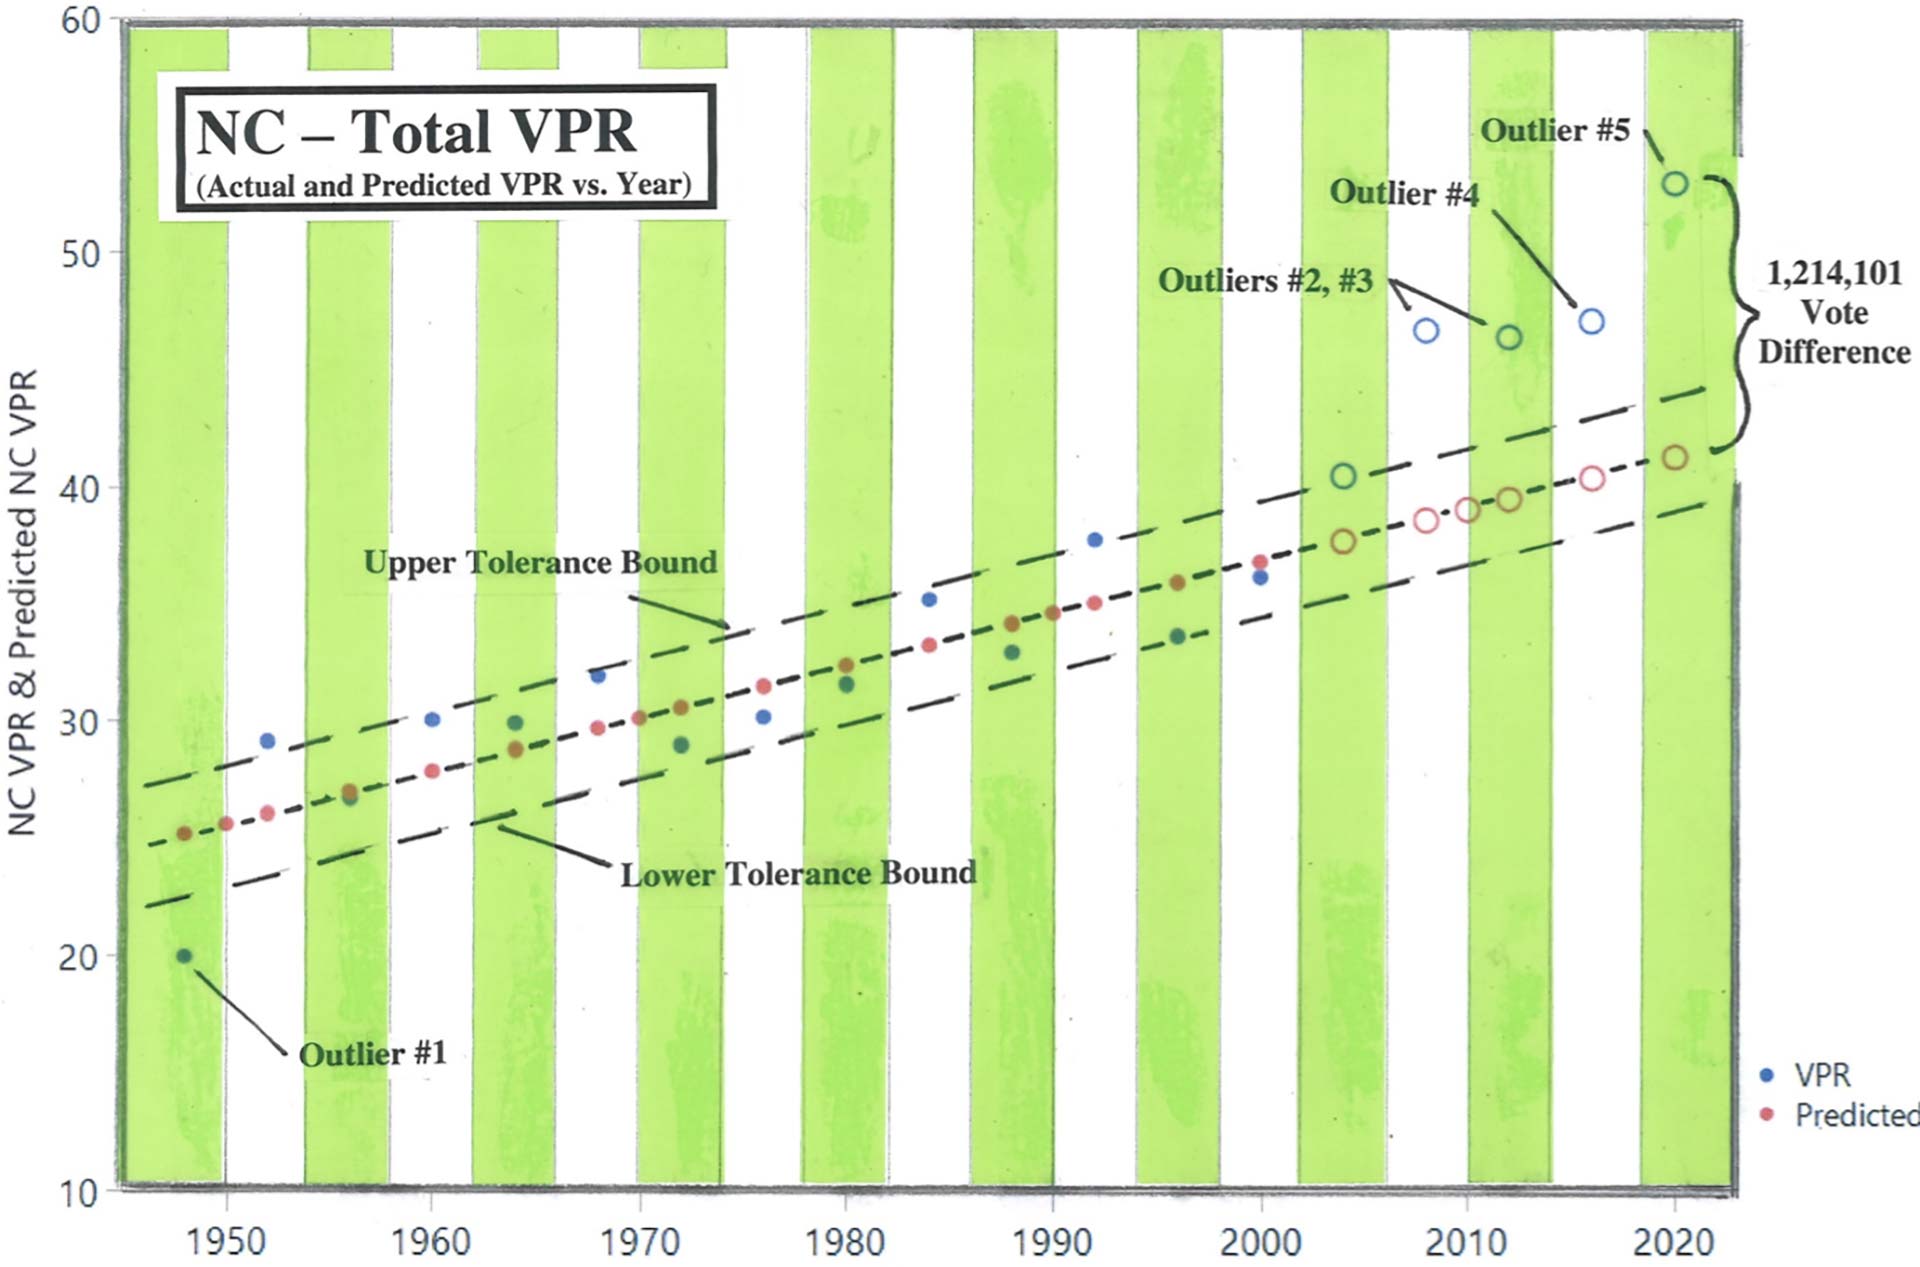
A positive incline trend for the total VPR. Most election results fall within the Tolerance Bounds up through the year of 2004.
Outlier #1 is the result of a lackluster campaign in 1948 with low turnout by both of the two major parties. The next time we see an Outlier regarding Total VPR are in the years of 2008 and 2012 with the election of Obama. With the election of the “First Black President” and with NC having a major Black population, this is the reason for the high turnout, especially for the Democrats. There is, however, no easy explanation for the Outliers of 2016 and 2020. And with no easy explanation, this opens the door for the possibility of nefarious activities by one or both of the two political parties. Also note the “Out-of-Line” vote is rather significant for the 2020 cycle, with the amount being 1.2 Million.
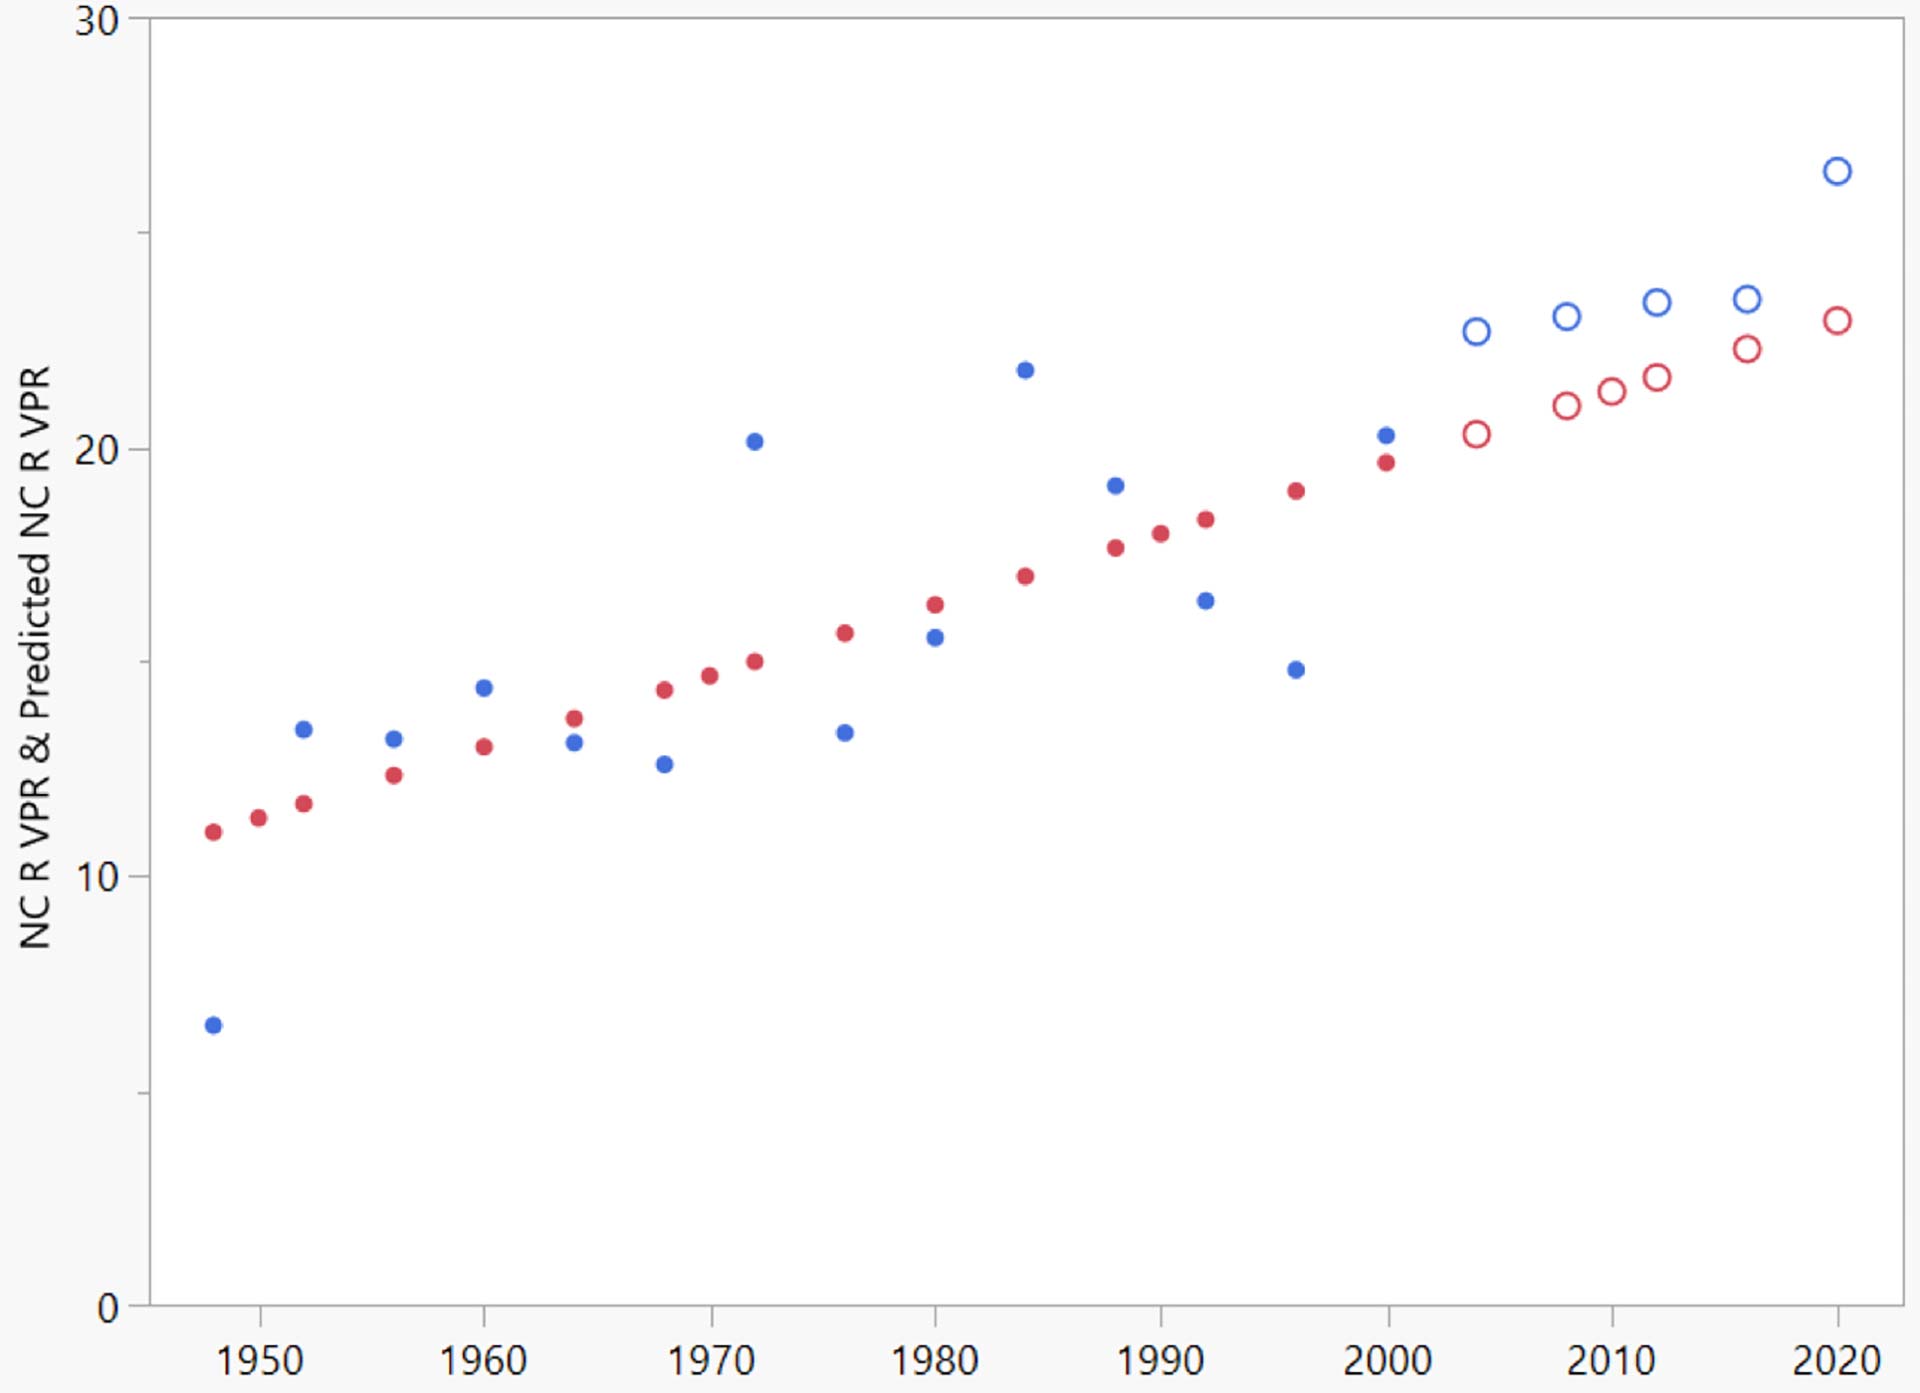
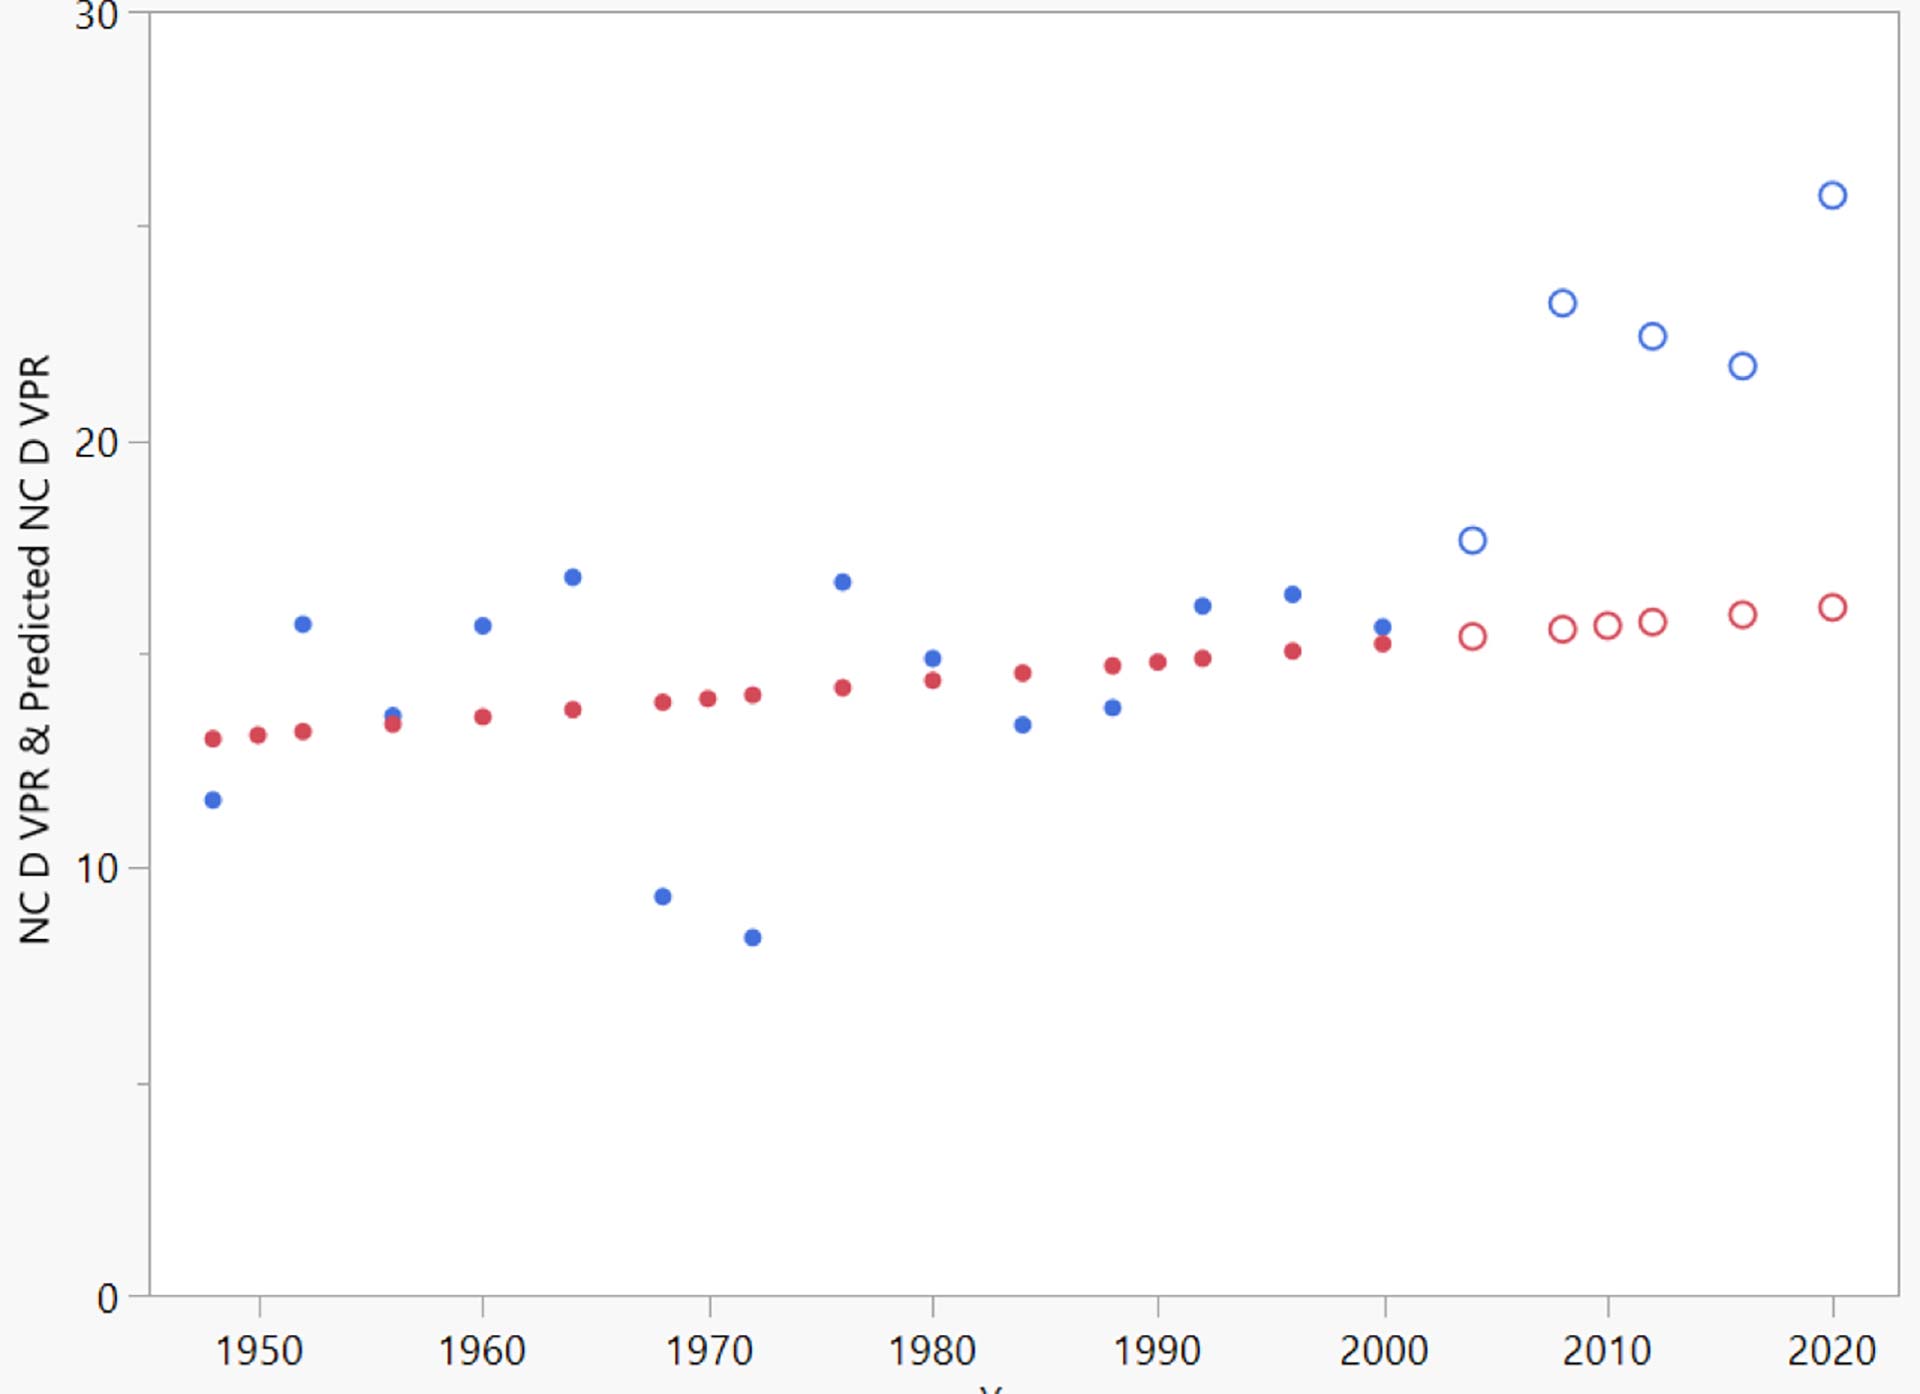
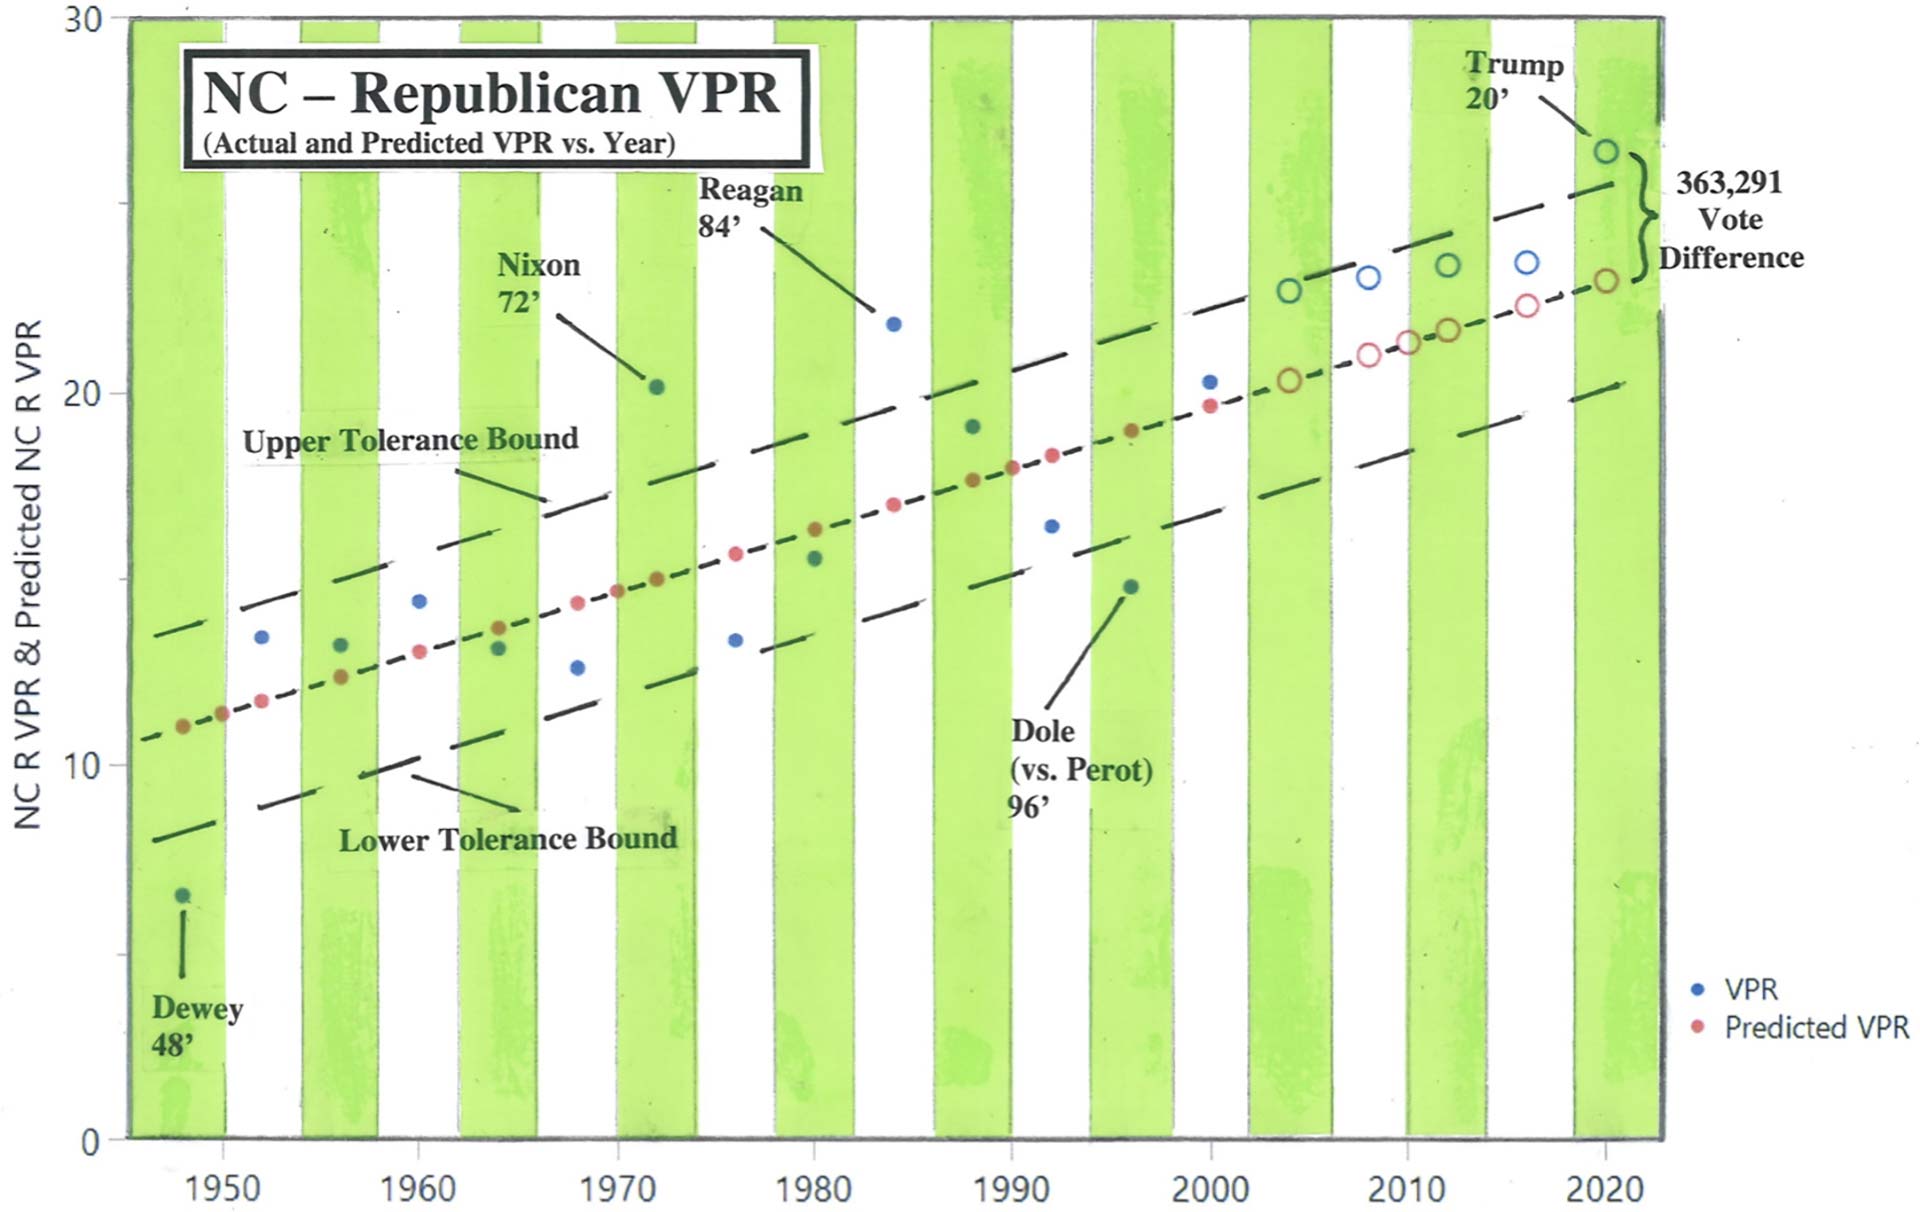
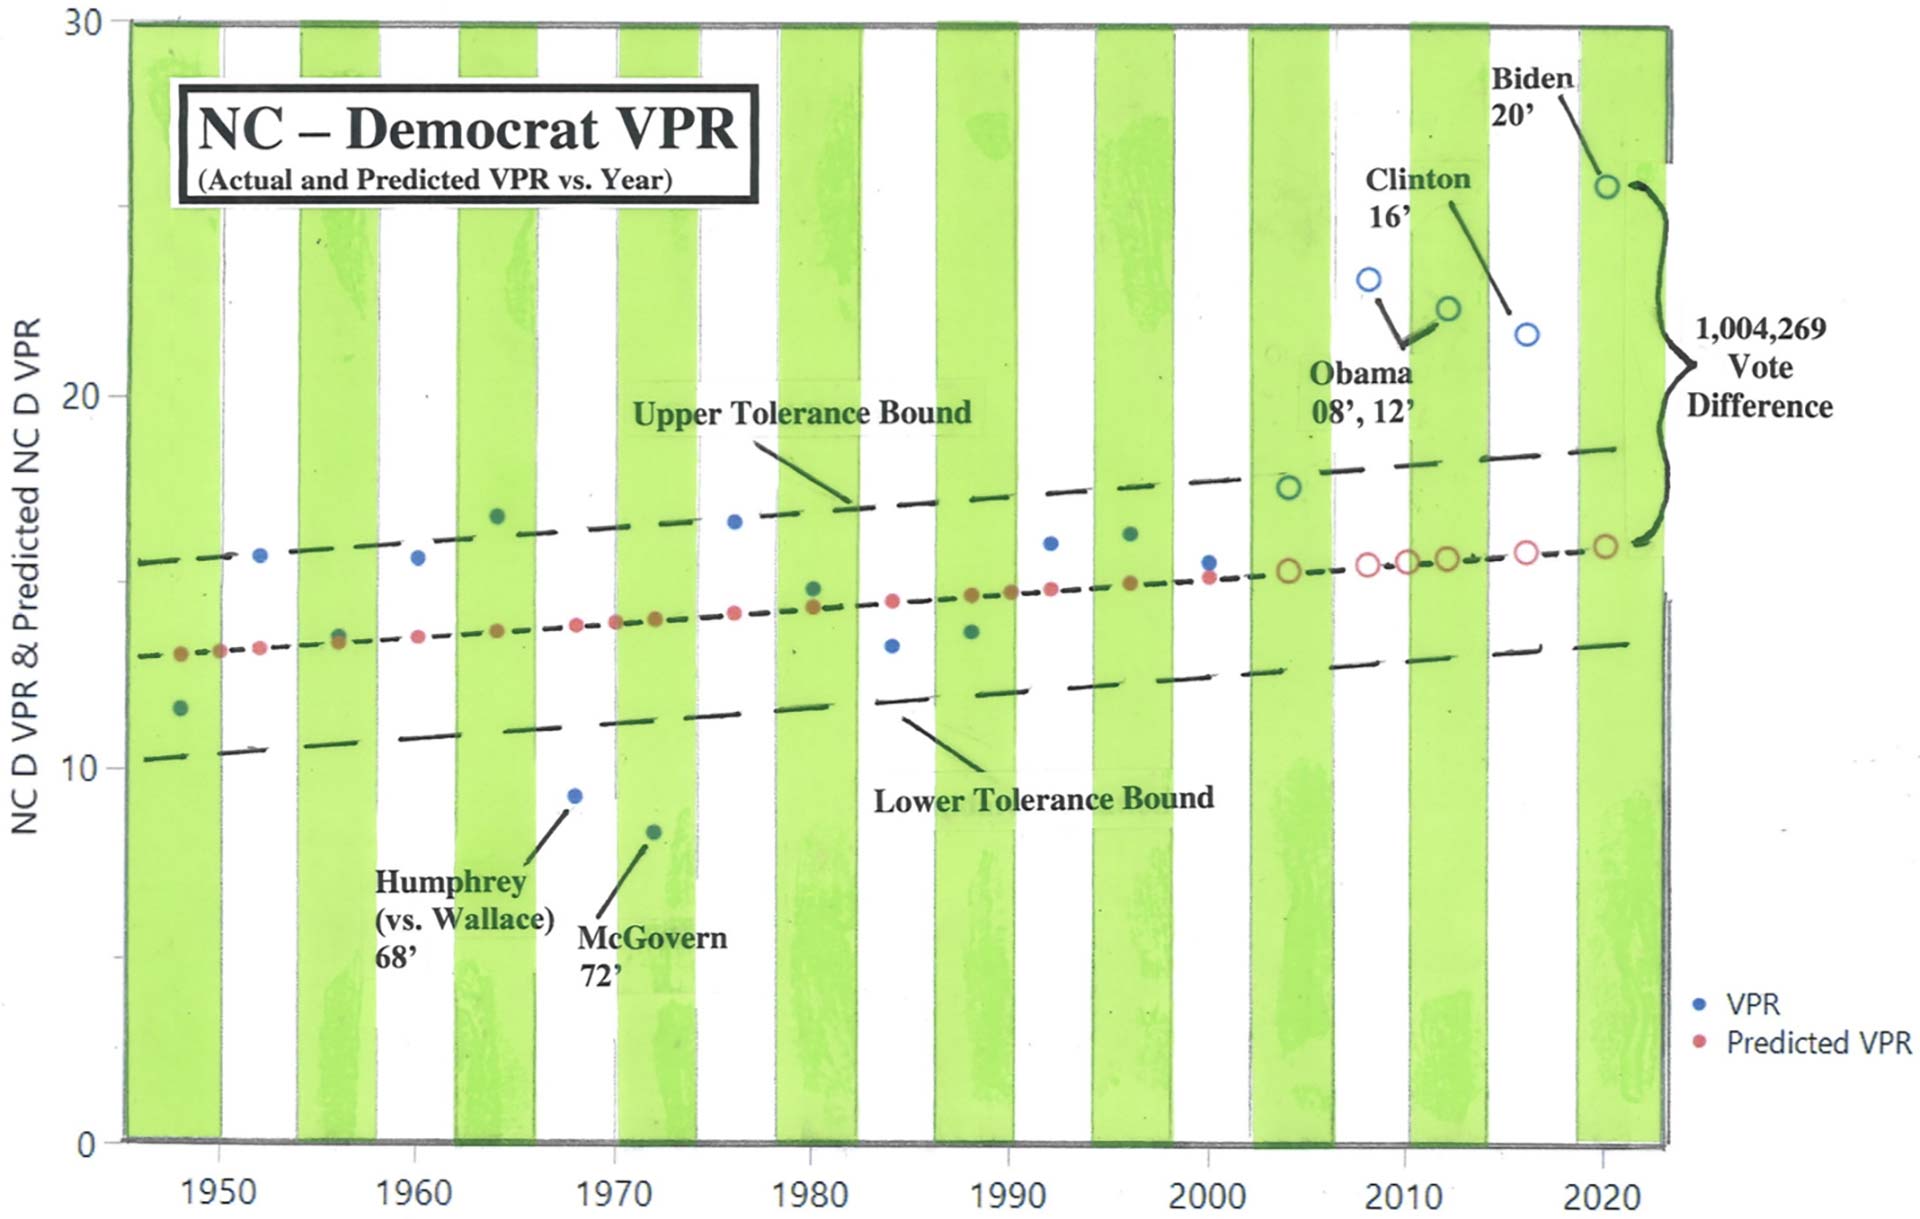
The long-term trend has been at a greater incline for the Republicans than the Democrats. There is, however, a breakout on the upside, for the Democrats starting in 2004.
As for individual cycles and starting in 1948, both parties performed below the trend, with what was considered generally a lackluster election for that cycle. In 1968, the Democrats were an Outlier on the negative side of the trend. This can easily be explained by the 3rd Party candidacy of George Wallace taking votes away from the Democrats. In 1972, Nixon was a positive Outlier with a landslide victory, with McGovern being a negative Outlier in that election; and with one outlier offsetting the other, that election was considered legitimate. A similar situation happened in 1984 with Reagan’s re-election victory; it was a positive Outlier for the Republicans, with a poor performance by the Democrats in that election. Dole was a negative Outlier in 1996; but this can be easily explained by Ross Perot generally taking votes away from the Republicans. Again, Obama has a strong showing in both 2008 and 2012, and this can be explained as an outlier because of NC’s large Black population. For 2016, there is little explanation as to why Clinton is an Outlier on the positive side of the trend line. And even more baffling is Biden’s performance in 2020. Note the Million “Out-of-Line” votes by the Democrats in that election.
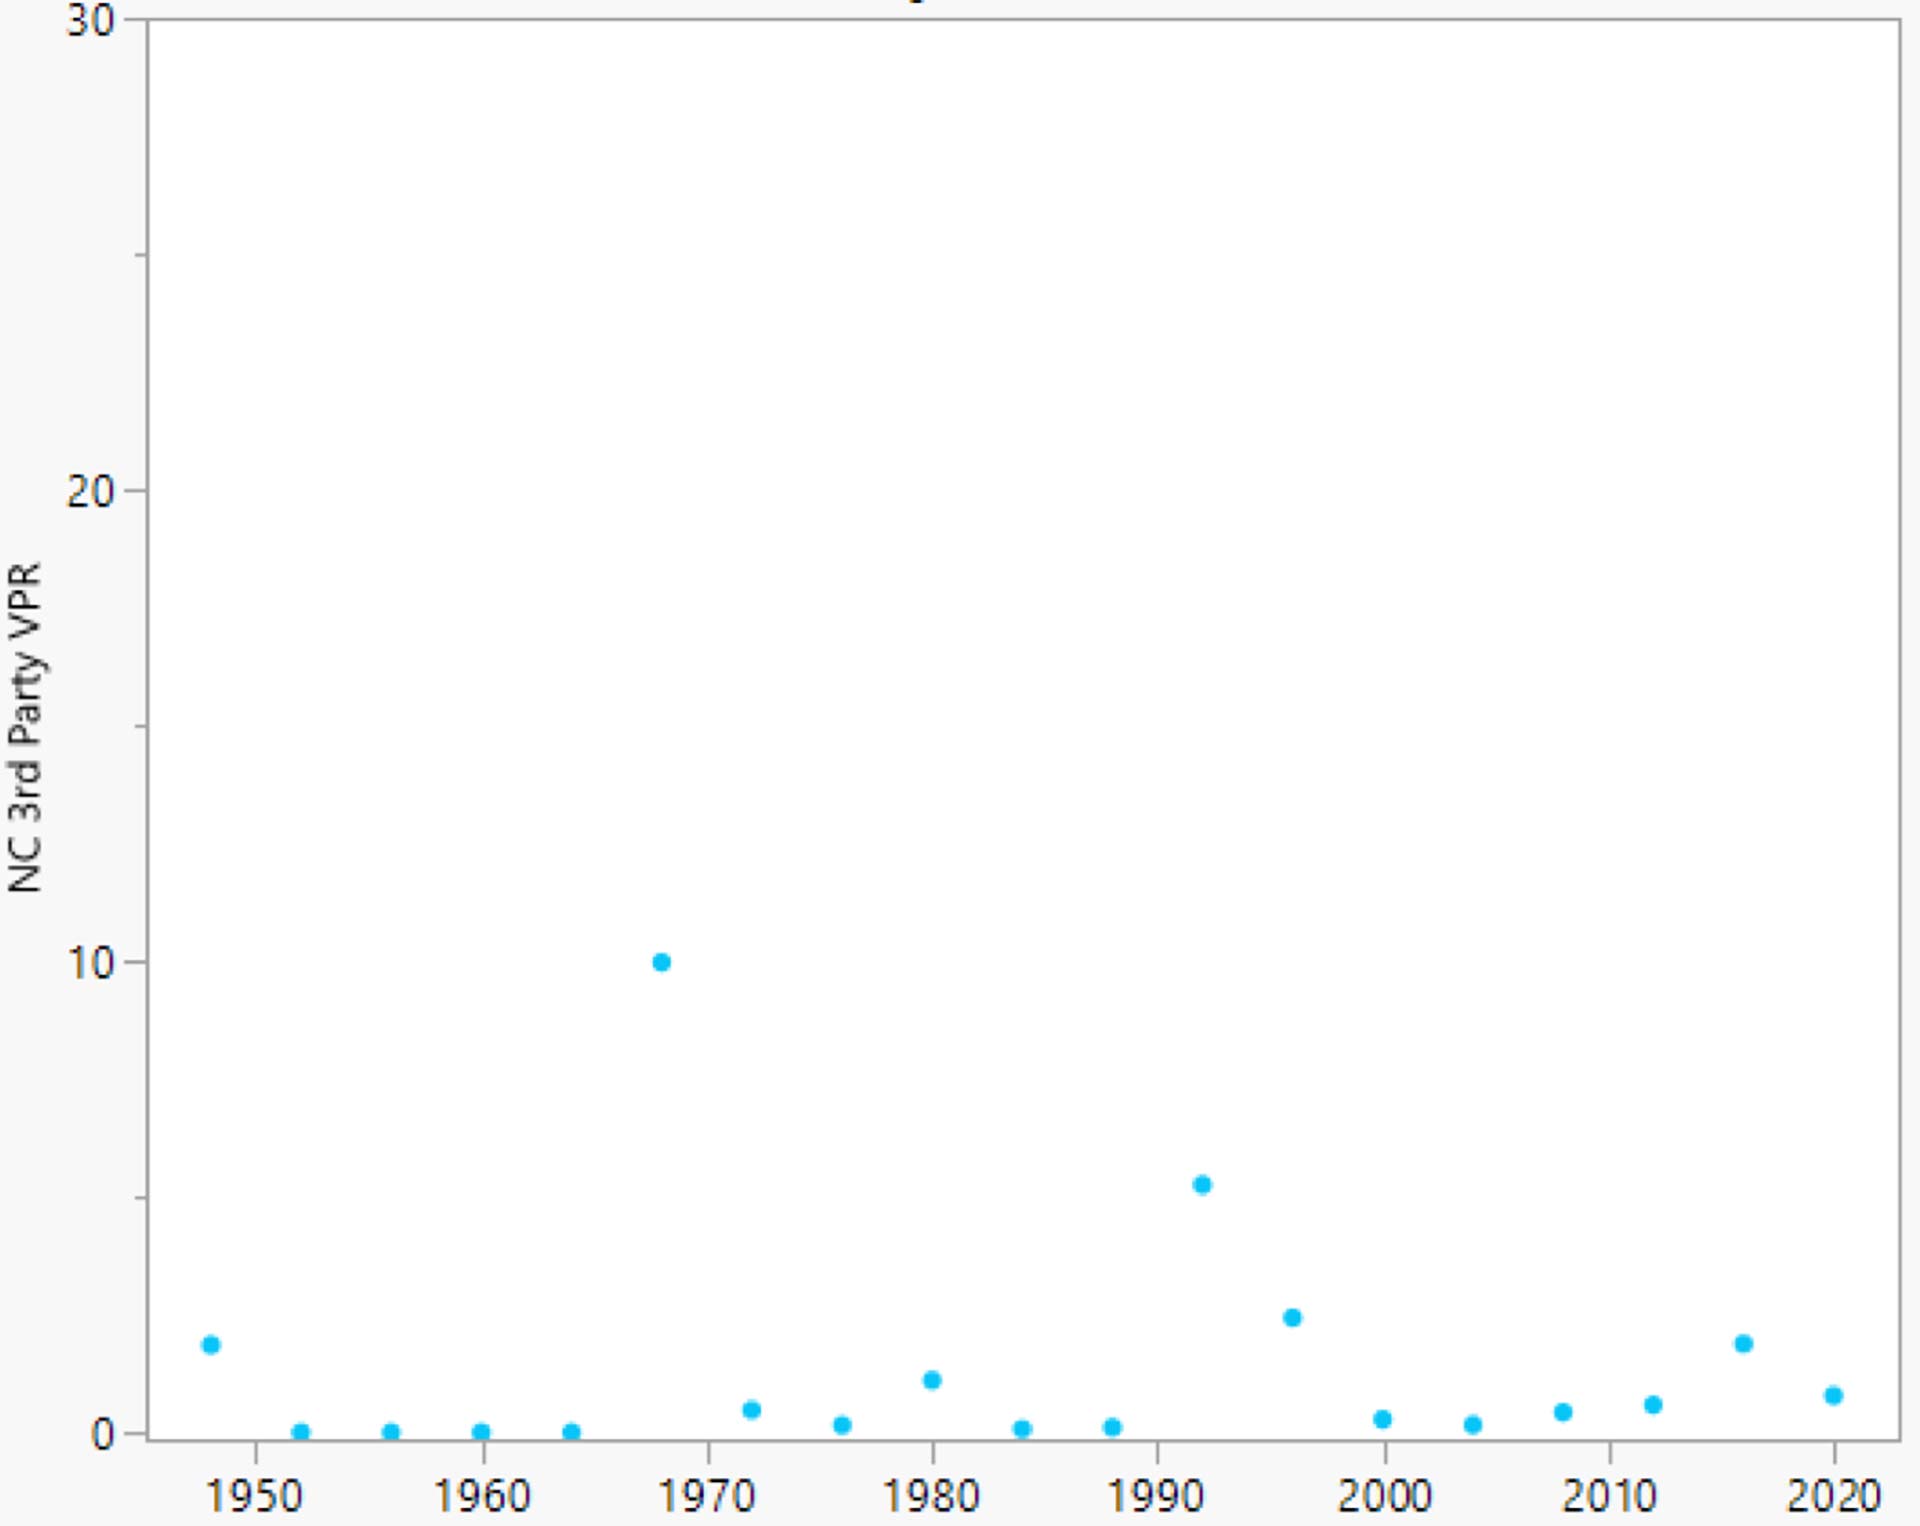
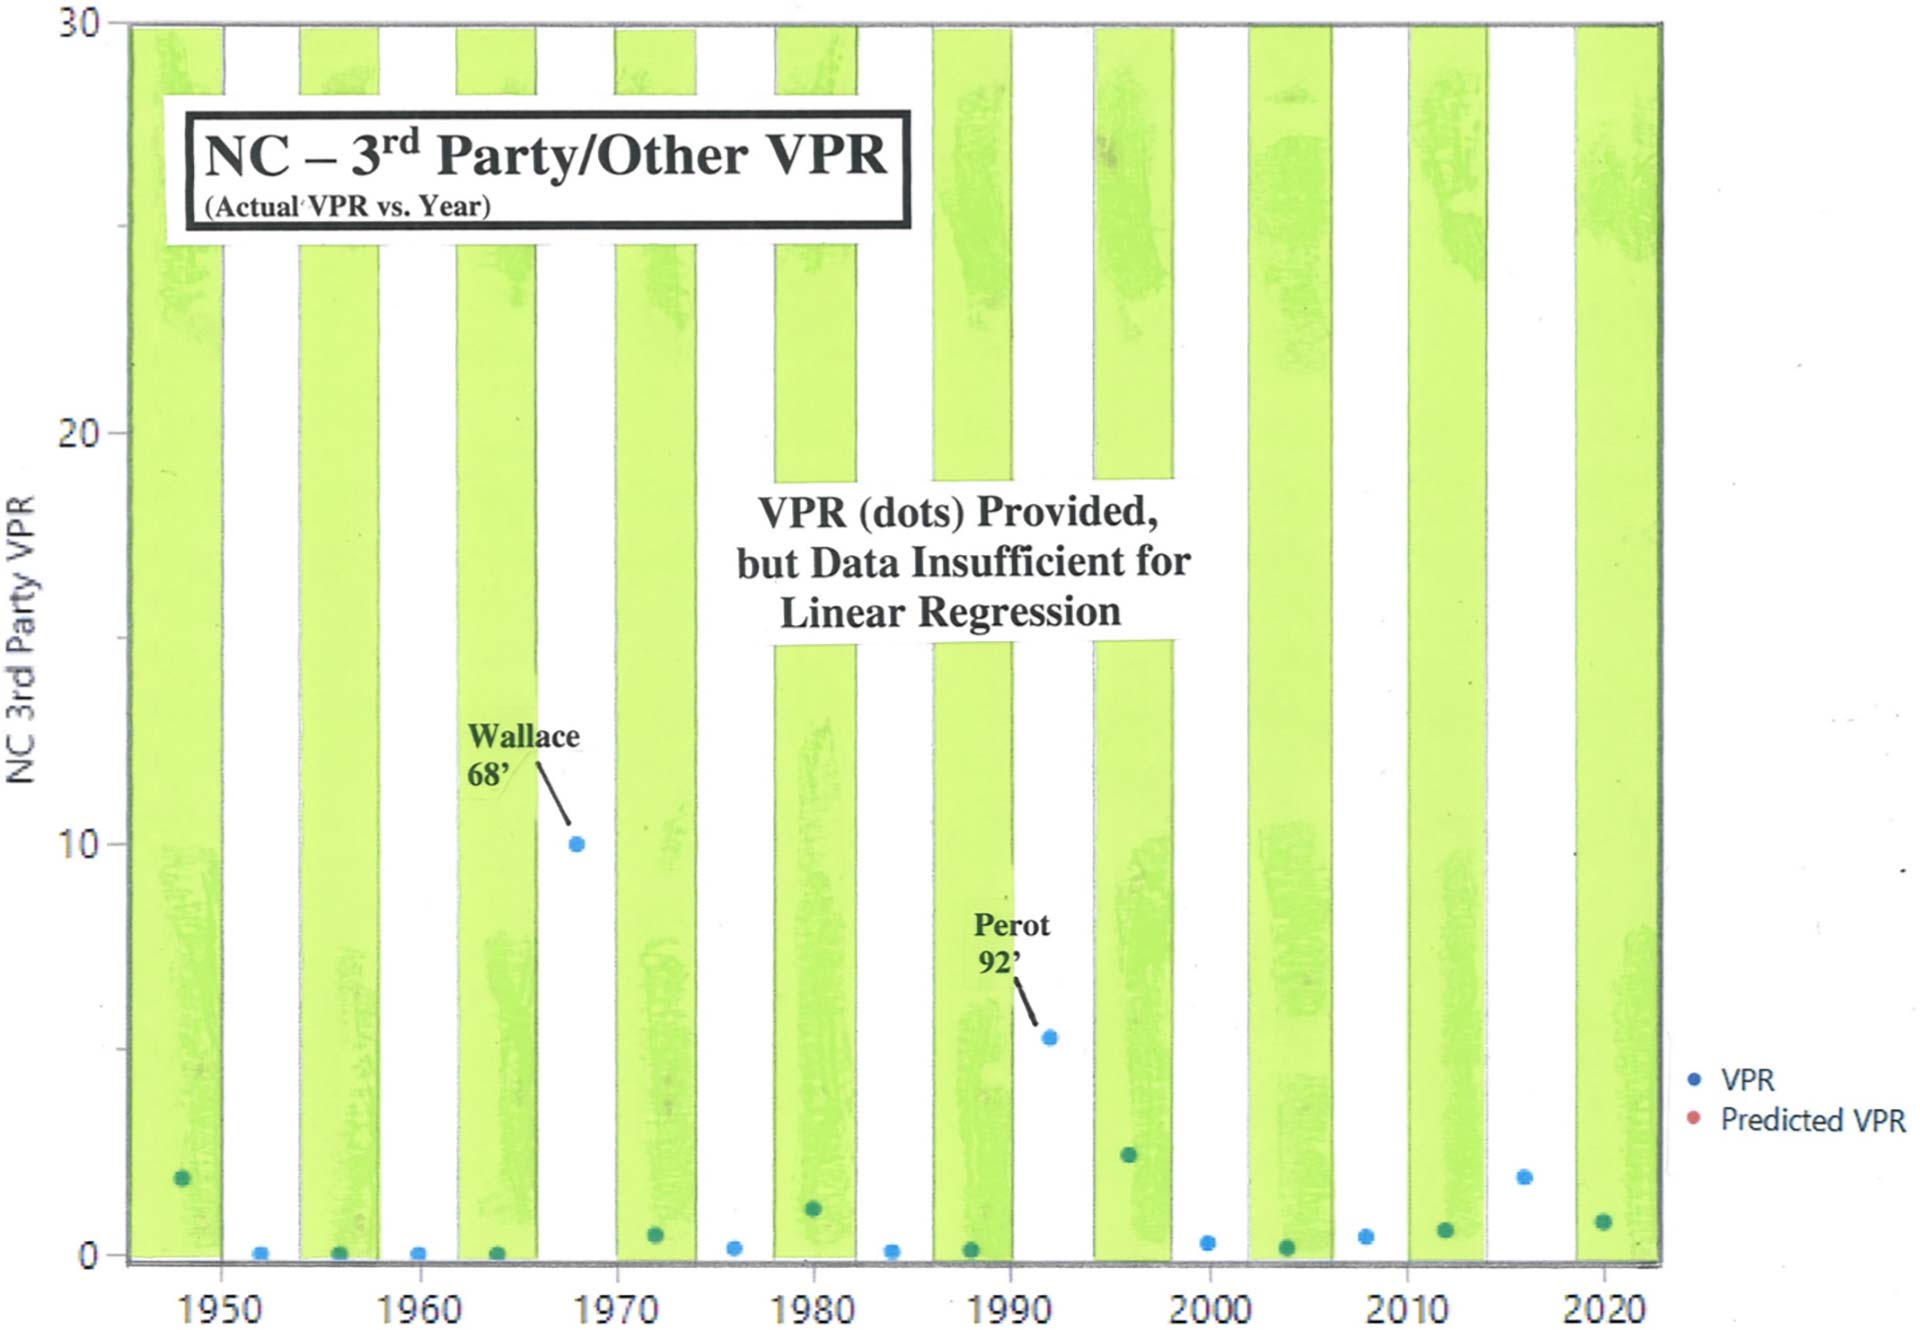
Very often this category of votes represents 1% or less, close to zero, of the total population. But in cycles where there is greater than a 1% showing, it generally creates havoc for the two major parties – often where one wins the popular vote and the other wins the Electoral College.
George Wallace captured 1/3 of the vote in NC for the election cycle of 1968. His taking votes away from the Democrats helped to elect Nixon in that election. Ross Perot had a strong showing in 1992, largely responsible for Clinton’s victory in that election. Perot’s support in 1996 was half of what it was before but still pulled enough votes away from the Republicans in order to partially explain Dole’s poor performance.
Because the 3rd Party vote is usually at or very close to zero (with the exception of 1948, 1968, 1992, 1996, and 2016), the Data for this section is Insufficient for Linear Regression Analysis.