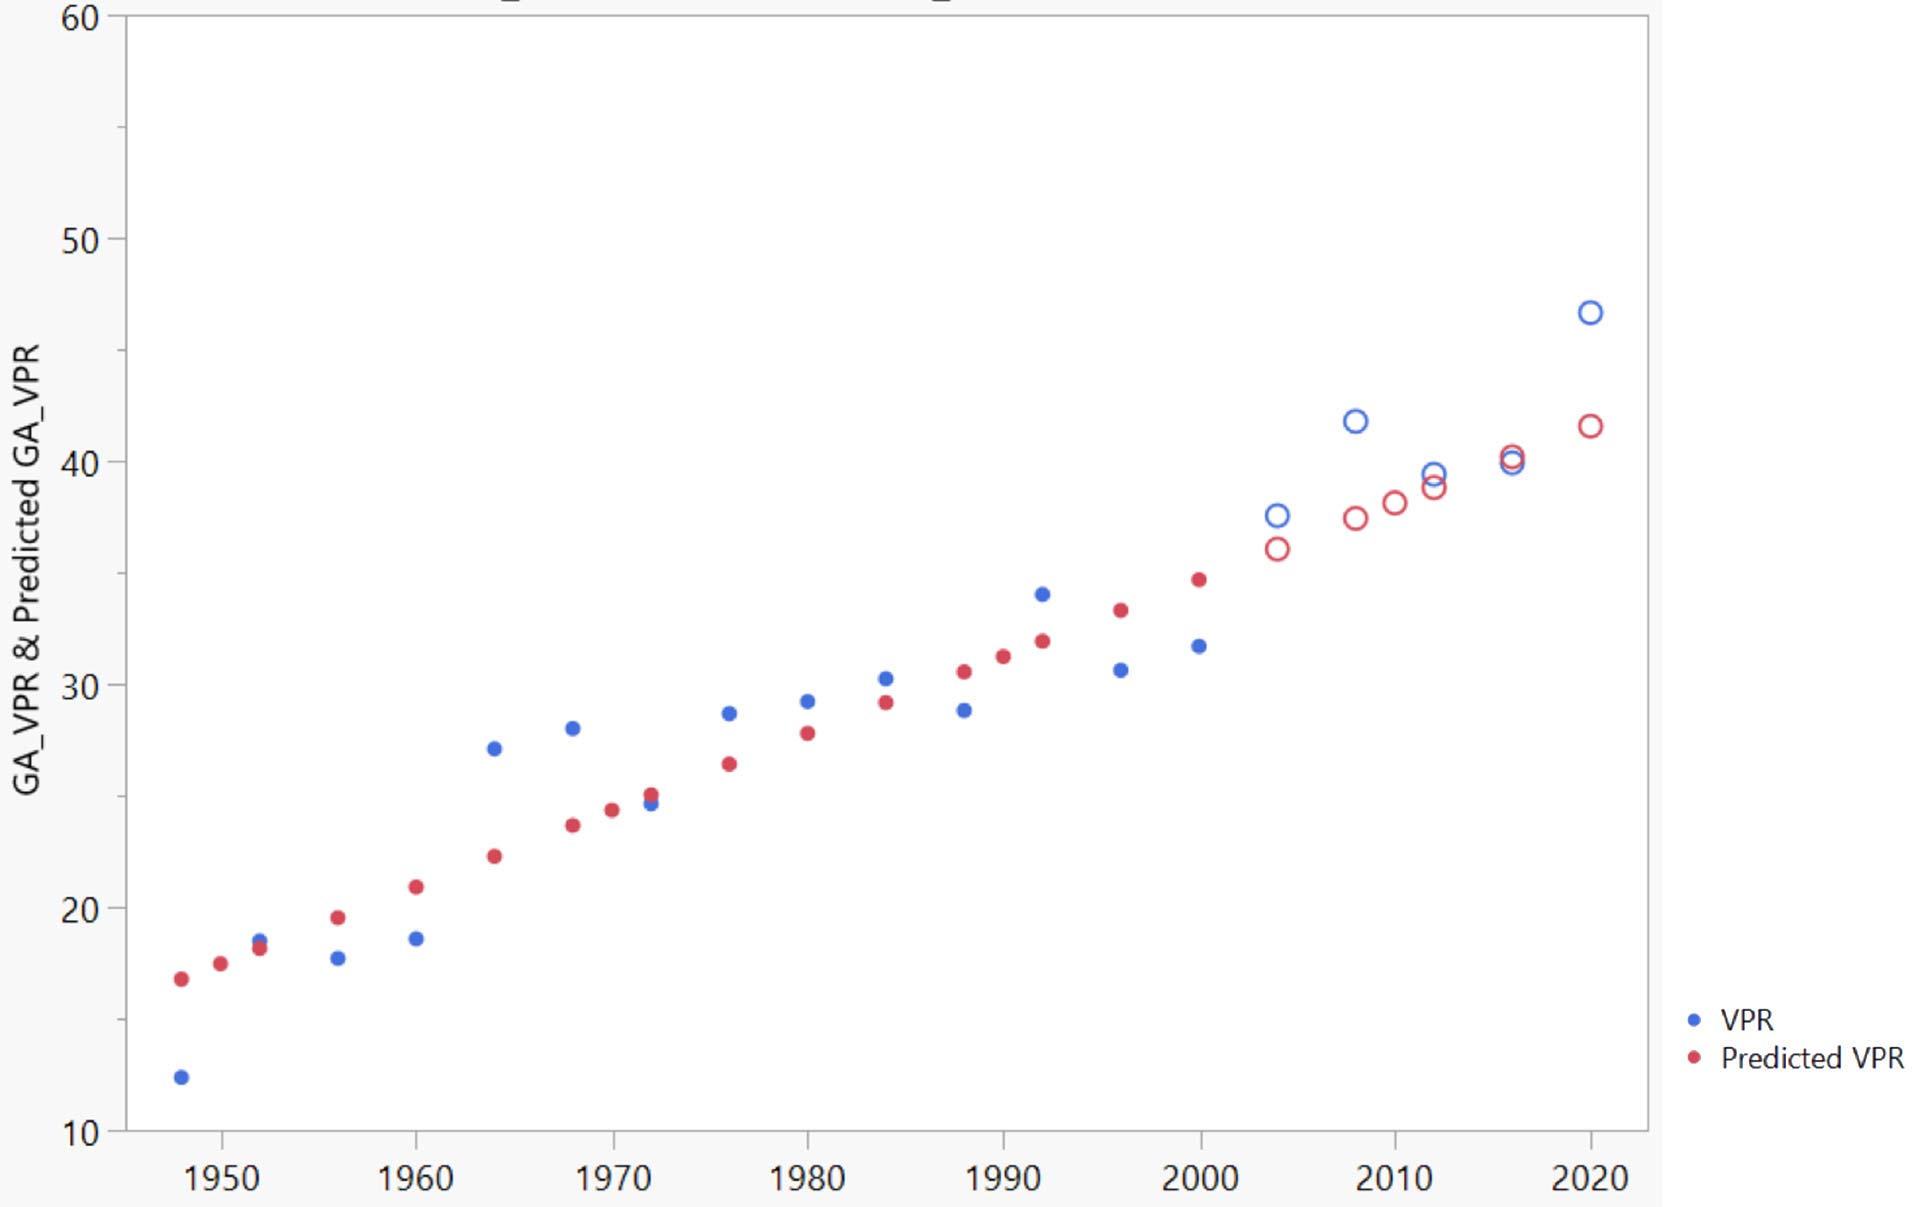
The data used for calculating both the VPR and the Predicted VPR, based on Official U.S. Government data, can be found below. From 2000 to 2020, the number of ballots cast in Georgia increased by 92.5%, but the population during this same period increased by only 30.87% – a 3.0 Times increase in ballots versus population.
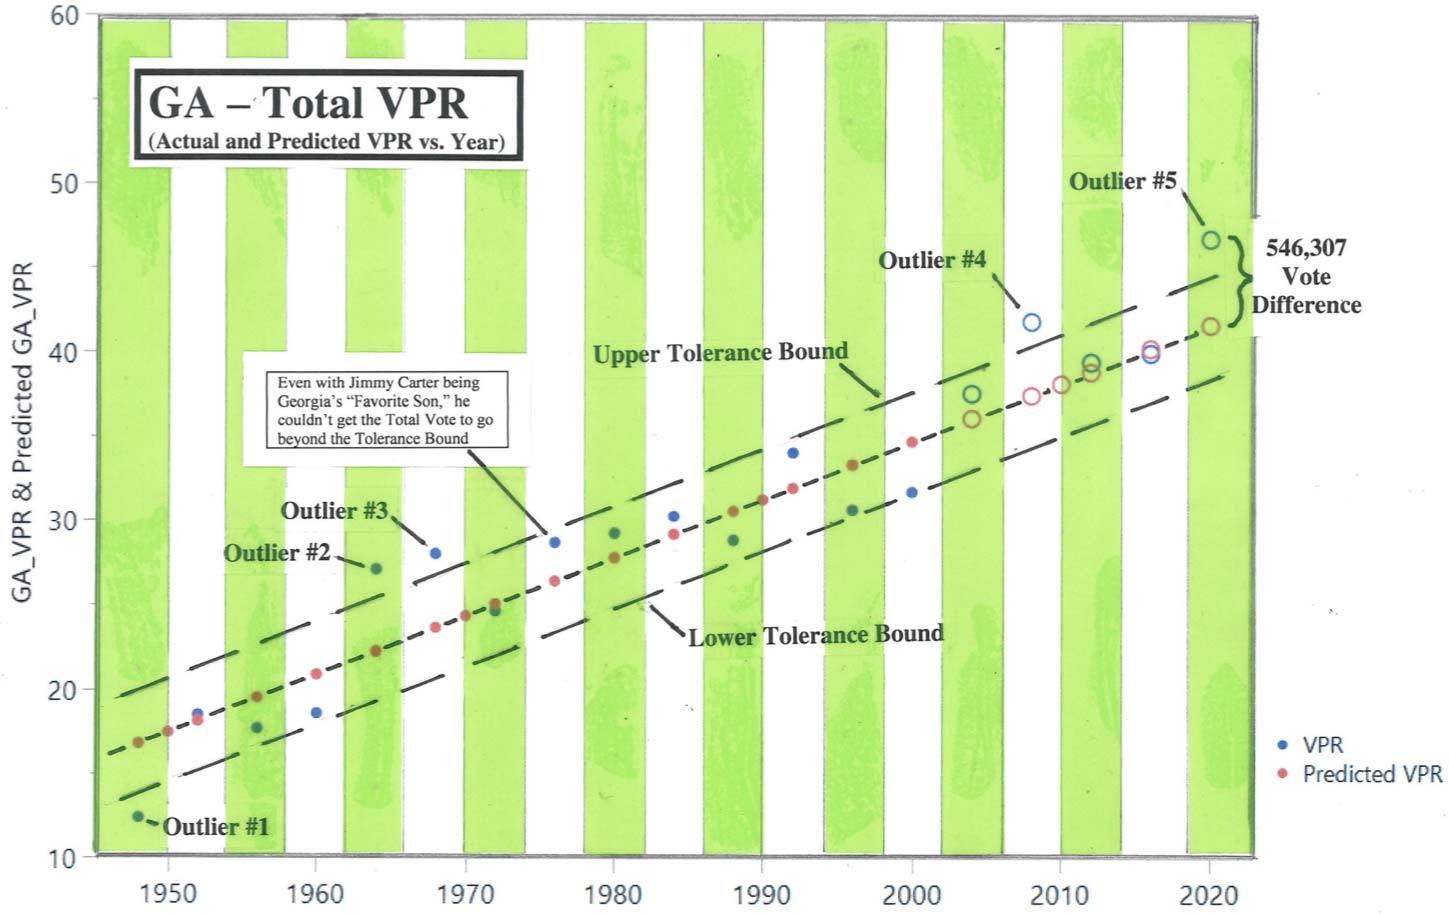
A positive incline trend for the total VPR. Most election results fall within the Tolerance Bounds up through the year of 2004.
Outlier #1 is the result of a lackluster campaign in 1948 with low turnout by both of the two major parties. The next time we see an Outlier regarding Total VPR is the year of 1964 with a very large turnout by both parties; while that year was a landslide victory for LBJ, Georgia was one of the few states the Goldwater actually won. Outlier #3 was the result of the 3 rd party candidacy of George Wallace, which brought in an additional number of votes for that year in Georgia. The next time we see an outlier was in the year of 2008 with the election of Obama. With Georgia having a large Black population, this explains Outlier #4. There is no easy explanation for Outlier #5 in 2020 with the election of Biden. Note the Total Vote Difference of 546,307 votes; this is significantly larger than what happened in 1976 with the election of Georgia’s “Favorite Son” – Jimmy Carter.
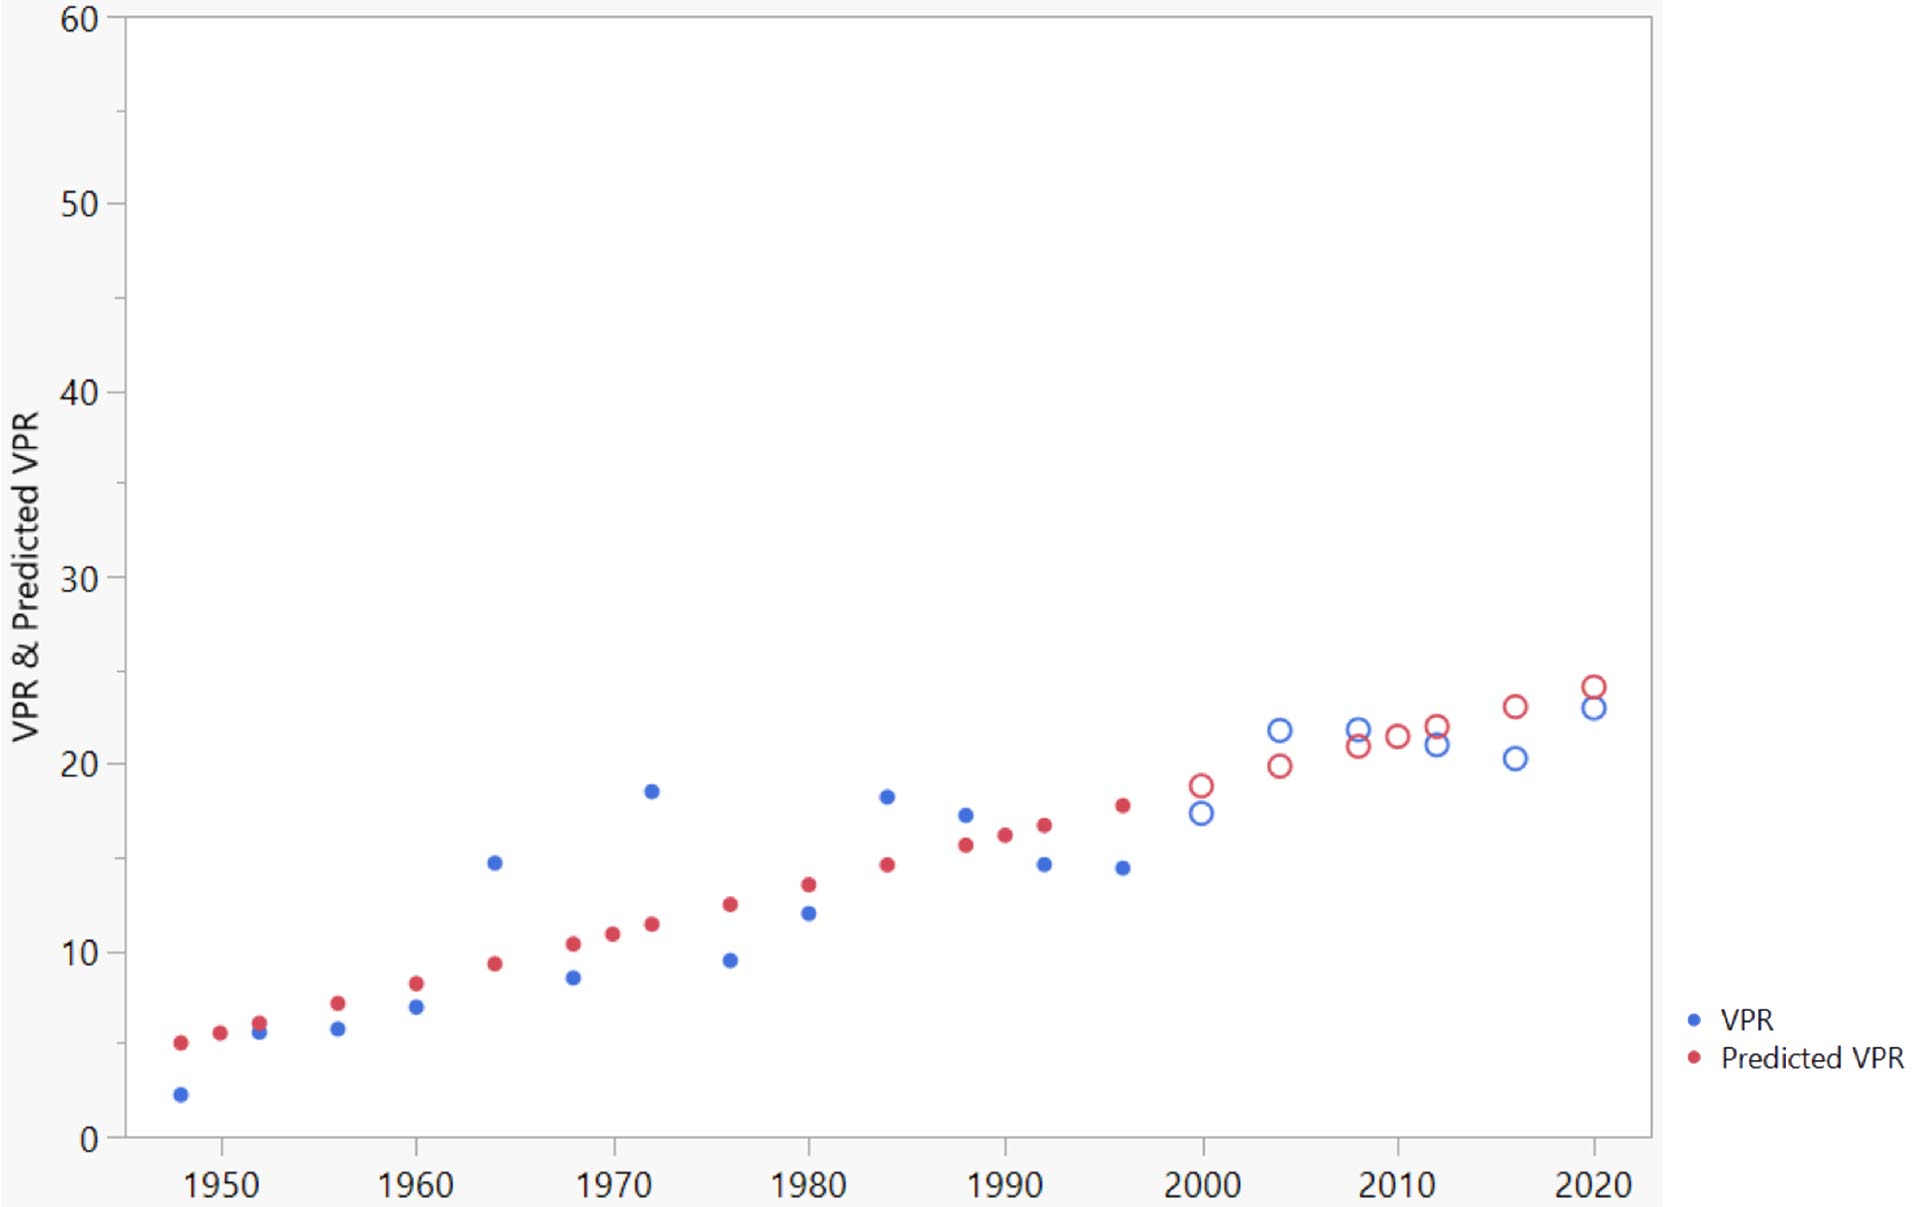
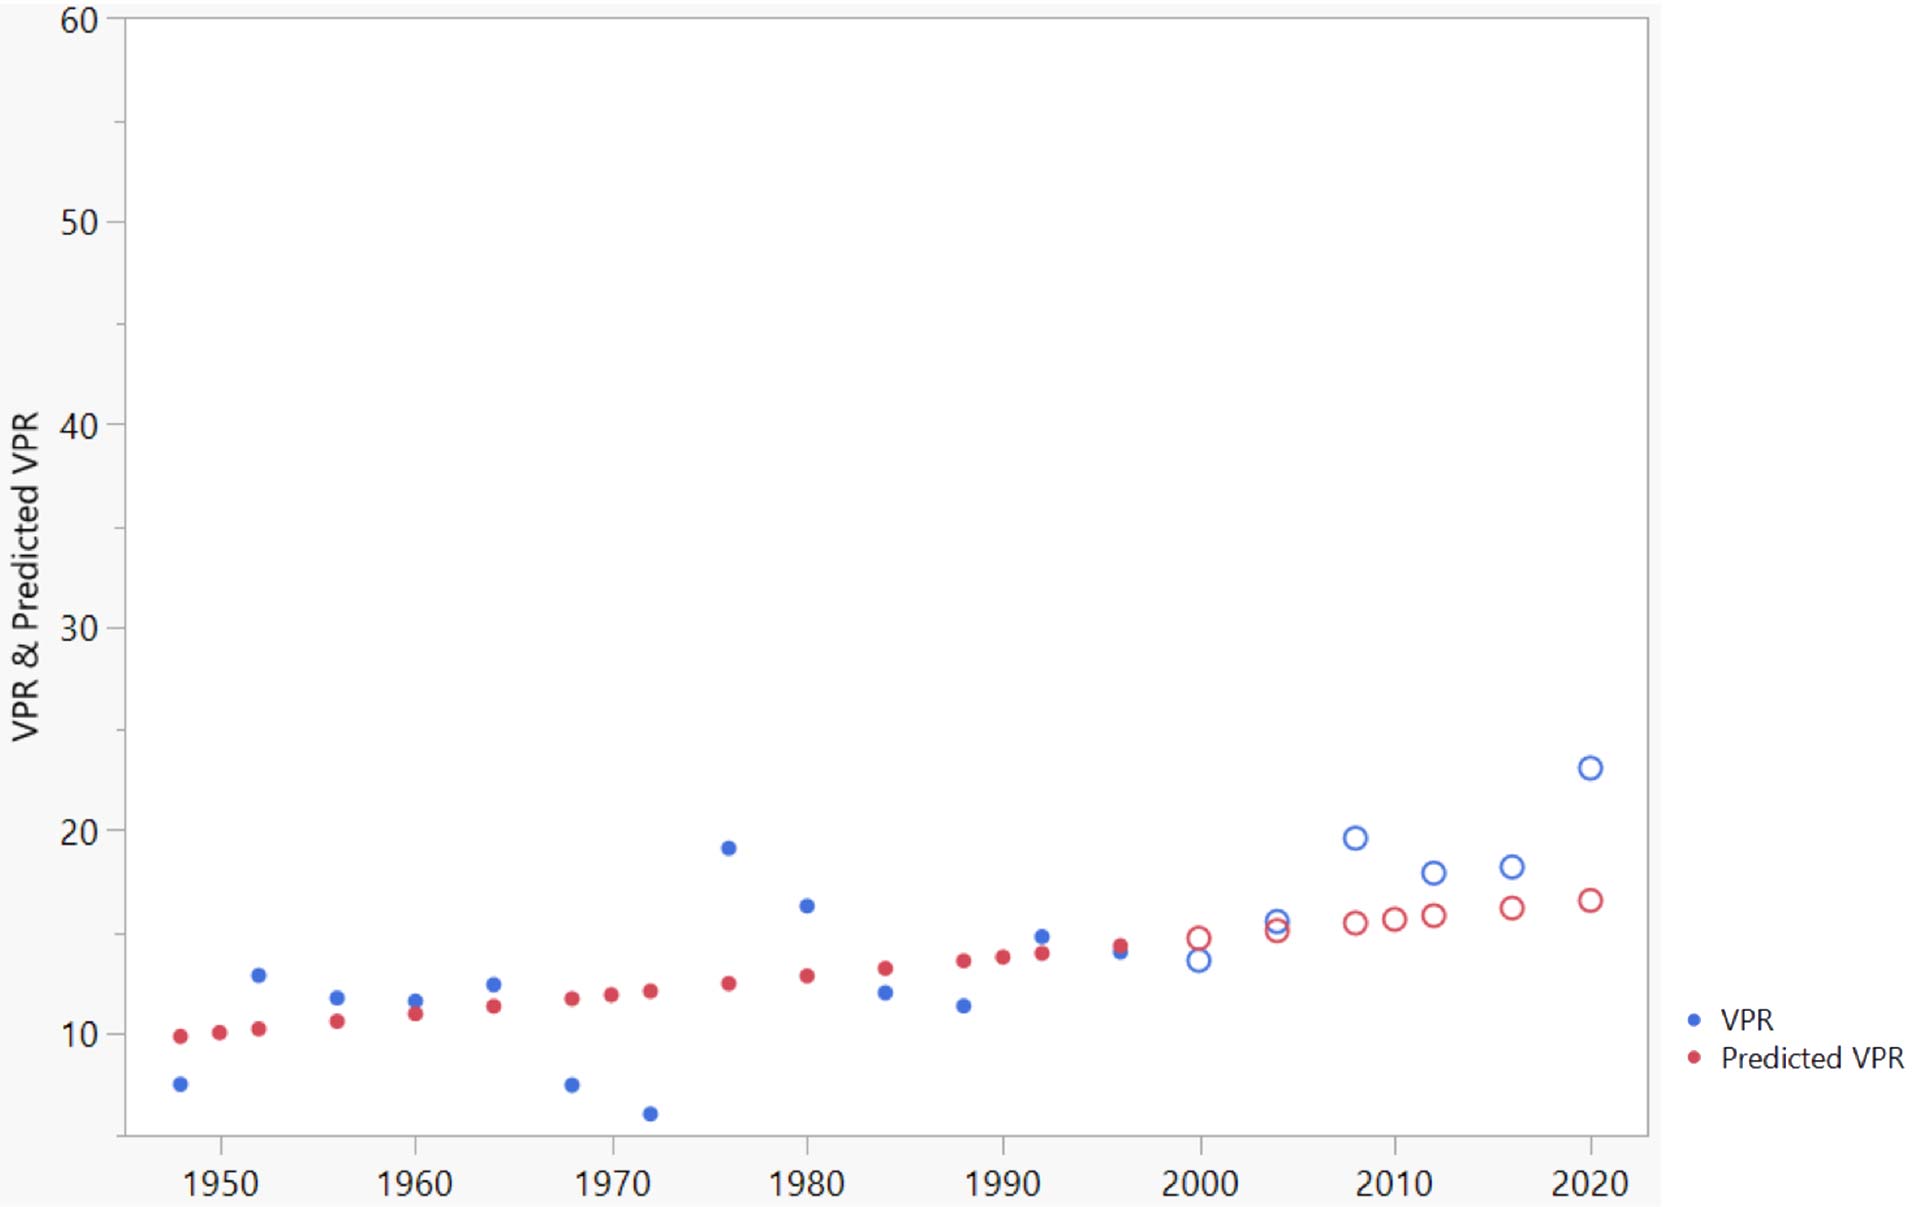
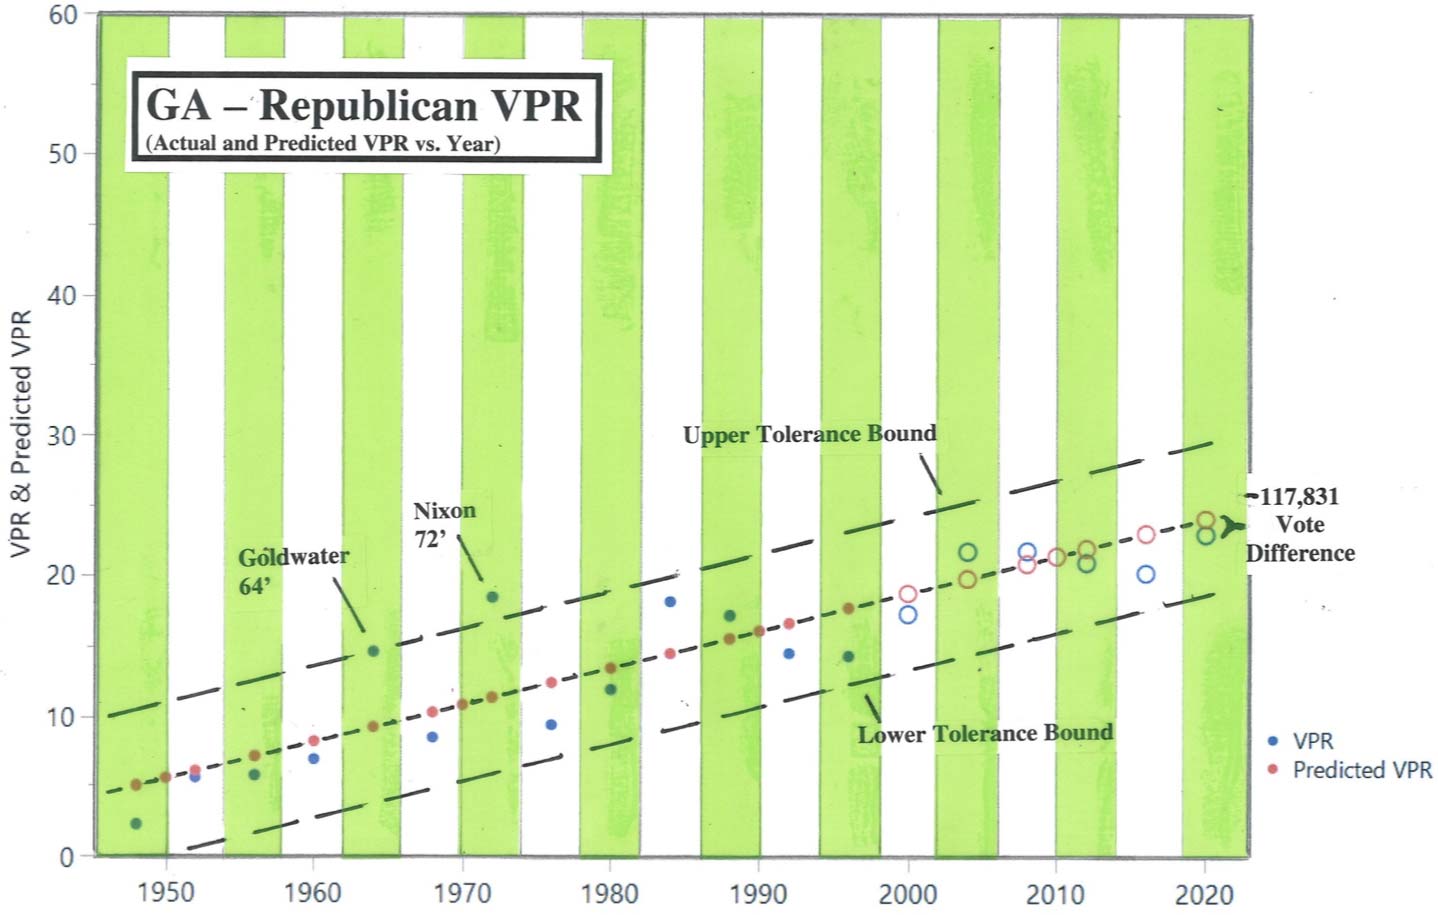
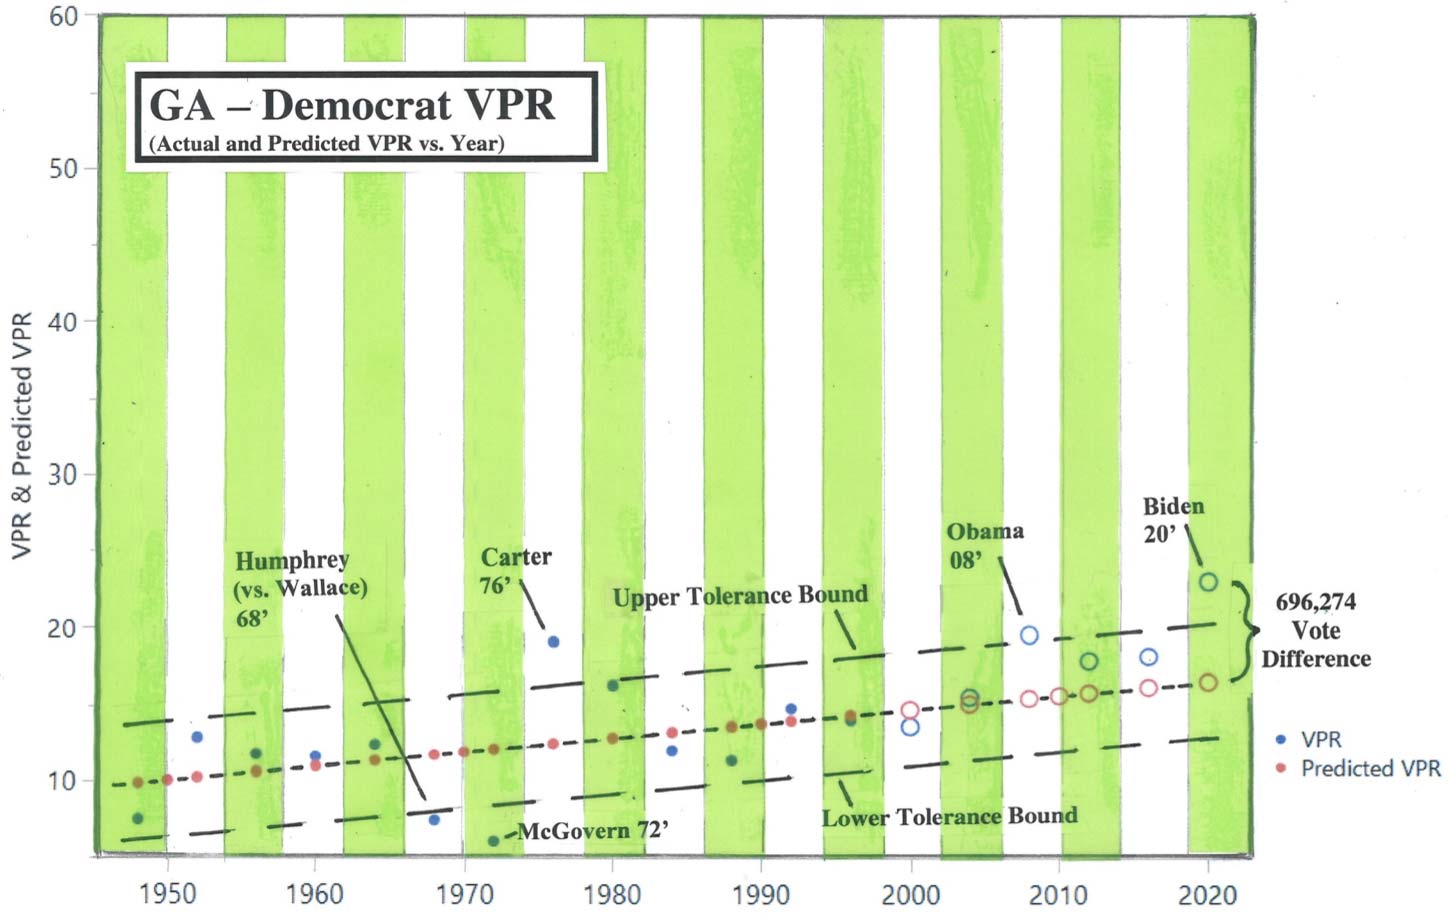
The long-term trend has been at a greater incline for the Republicans than the Democrats. There is, however, a breakout on the upside, for the Democrats starting in 2004.
As for individual cycles and starting in 1964, Goldwater did exceptional well, with LBJ doing well also (being just above the trend line). There might, however, be some question about this election, since we didn’t see the traditional “offsetting vote” from one party VPR to the other. In 1968, the Democrats were below the Tolerance Bound, with George Wallace mainly taking votes away from the Democrats. In 1972, Nixon was above the Tolerance Bound for the Republicans, with an offsetting below the Tolerance Bound by McGovern. In 1976, Carter was above the (party) Tolerance Bound, with many in Georgia coming out to support the Democrats. In 2008 with the election of Obama, the party vote was exceptional but barely above the Tolerance Bound – even with Georgia having a large Black population. Again in 2020, there is no easy explanation for Biden’s level of support regarding the party vote – a level similar to that of Carter (with Carter being Georgia’s “Favorite Son”). Also a bit unusual about the 2020 Election is the fact that the Republican VPR was below the Trend Line, which is totally different from the surrounding states. Note the Vote Difference off the Trend line of 696,274 votes for the Democrats, with about half of that being above the Tolerance Bound – the “Out-of-Line” votes.
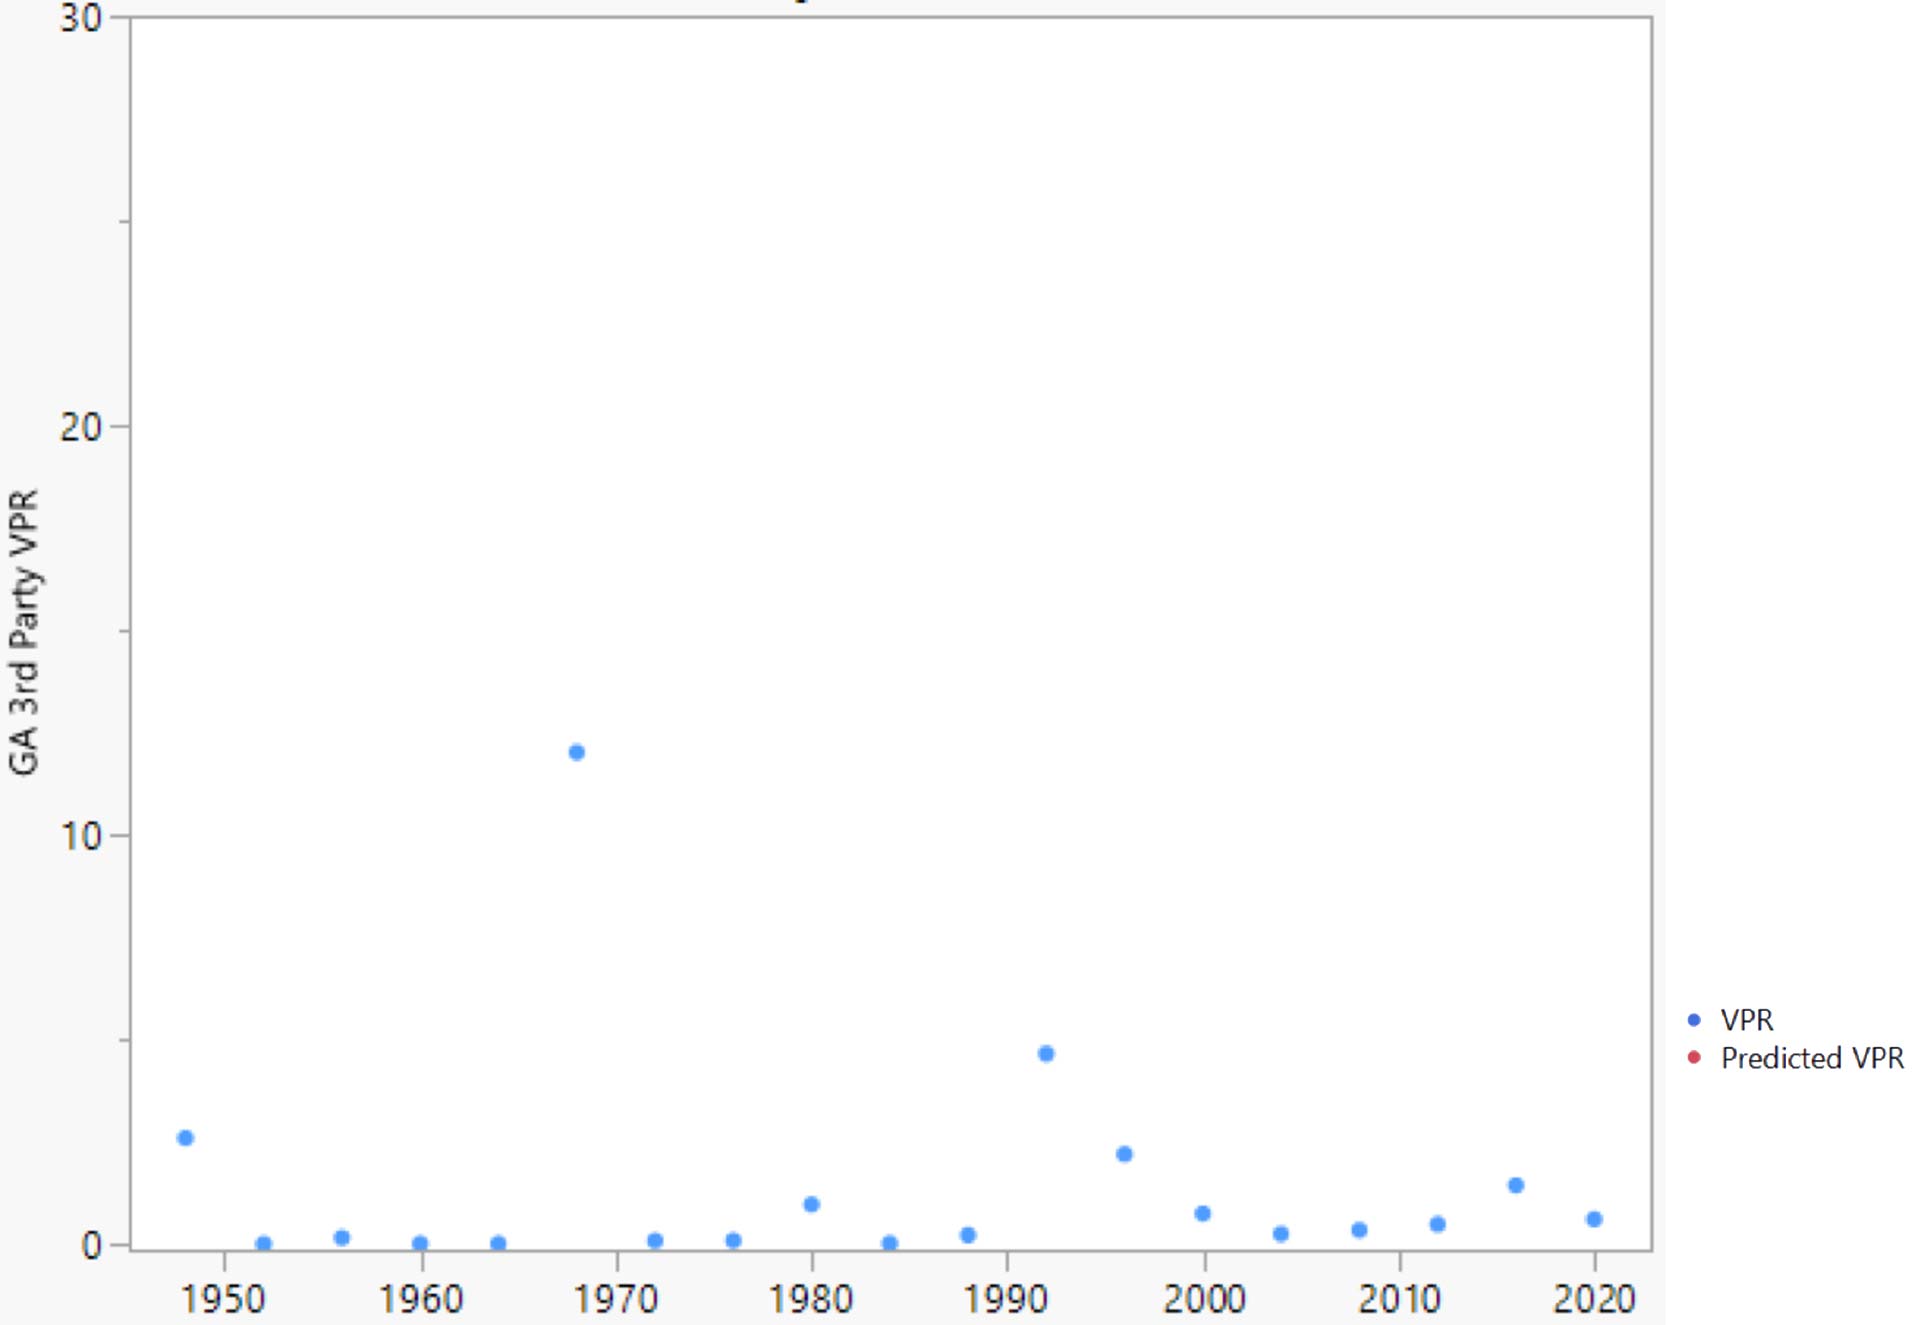
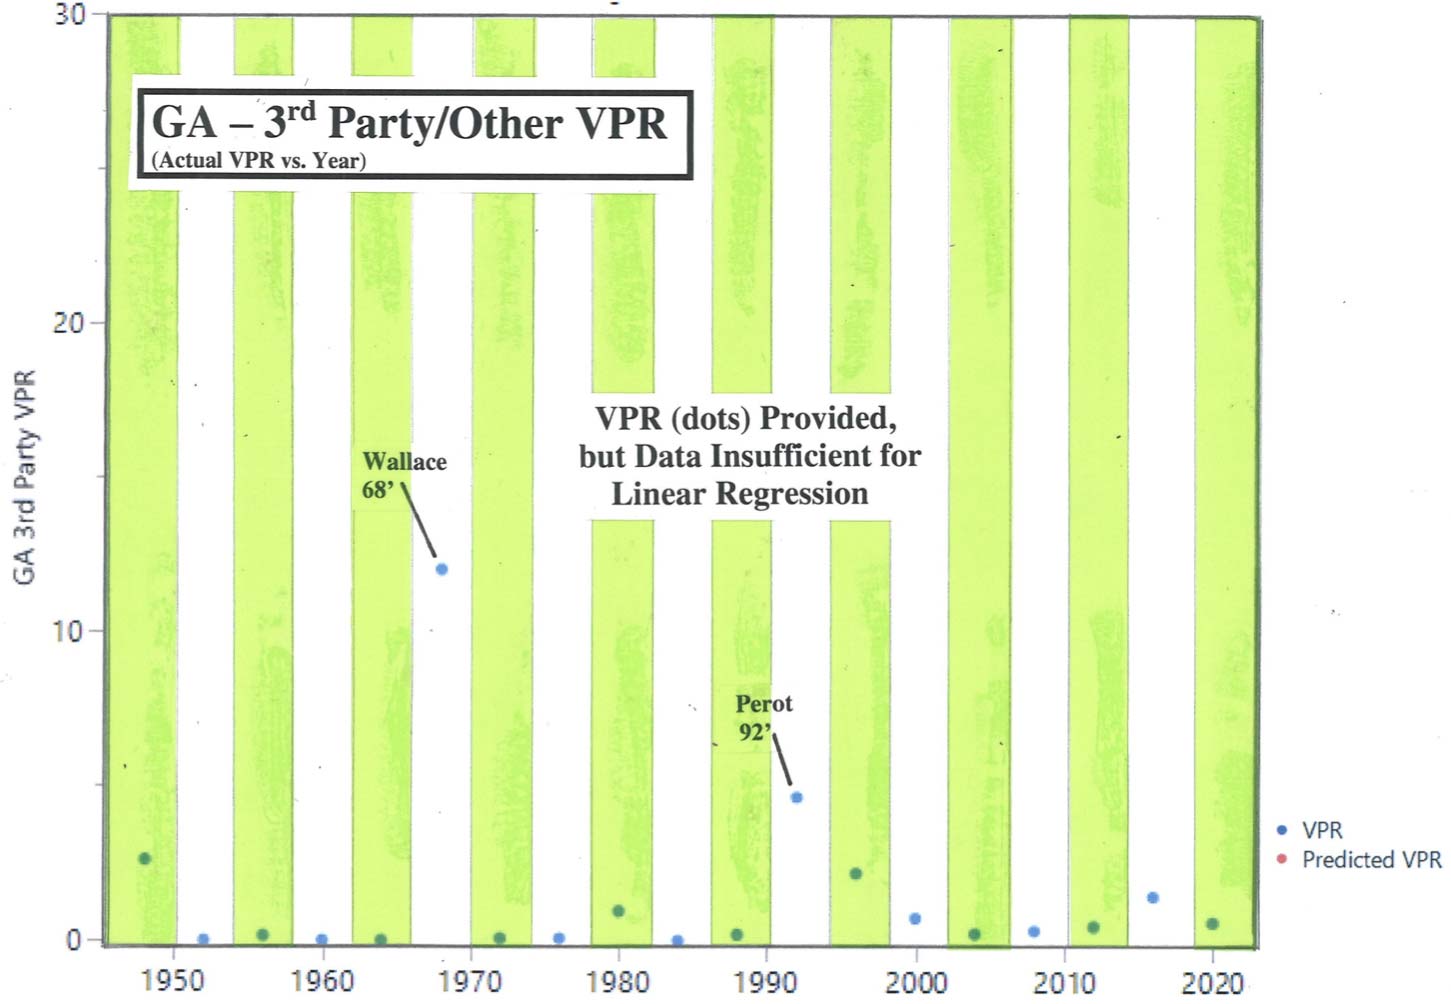
Very often this category of votes represents 1% or less, close to zero, of the total population. But in cycles where there is greater than a 1% showing, it generally creates havoc for the two major parties – with the election being “thrown” from one party to the other..
George Wallace actually won the majority of the vote in Georgia for the election cycle of 1968. His taking votes away from the Democrats helped to elect Nixon on the national level. Ross Perot had a strong showing in 1992, largely responsible for Clinton’s victory in that election. Perot’s support in 1996 was half of what it was before but still pulled enough votes away from the Republicans to help re-elect Bill Clinton.
Because the 3rd Party vote is usually at or very close to zero (with the exception of 1948, 1968, 1992, 1996, and 2016), the Data for this section is Insufficient for Linear Regression Analysis.