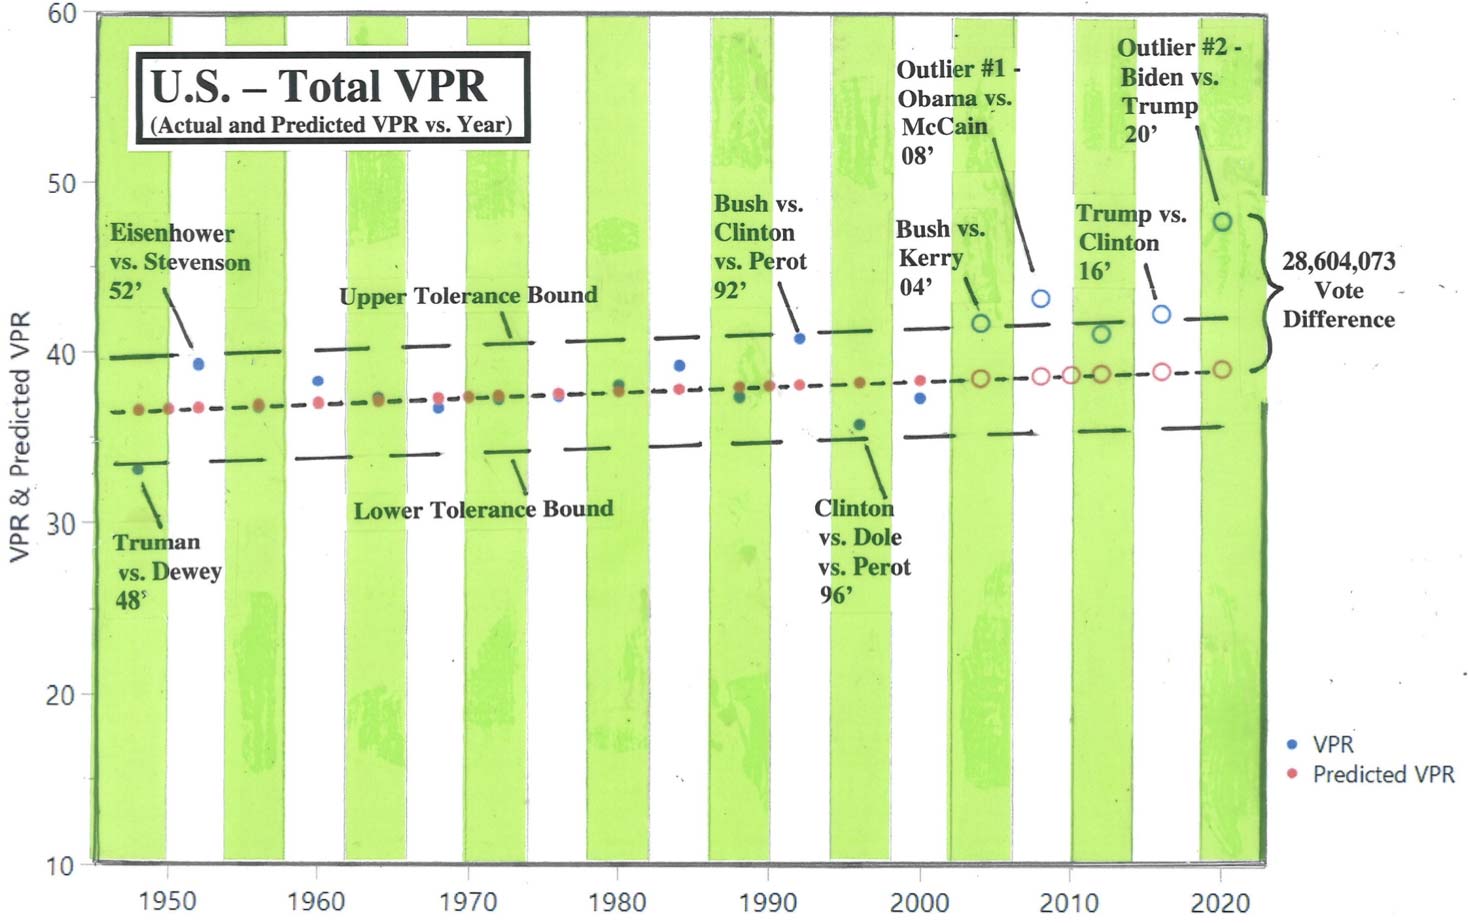
The data used for calculating both the VPR and the Predicted VPR, based on Official U.S. Government data, can be found below. From 2000 to 2020, the number of ballots cast in the United States has increased by 50.3%, but the population during this same period increased by only 17.8% – a 2.8 Times increase in ballots versus population.
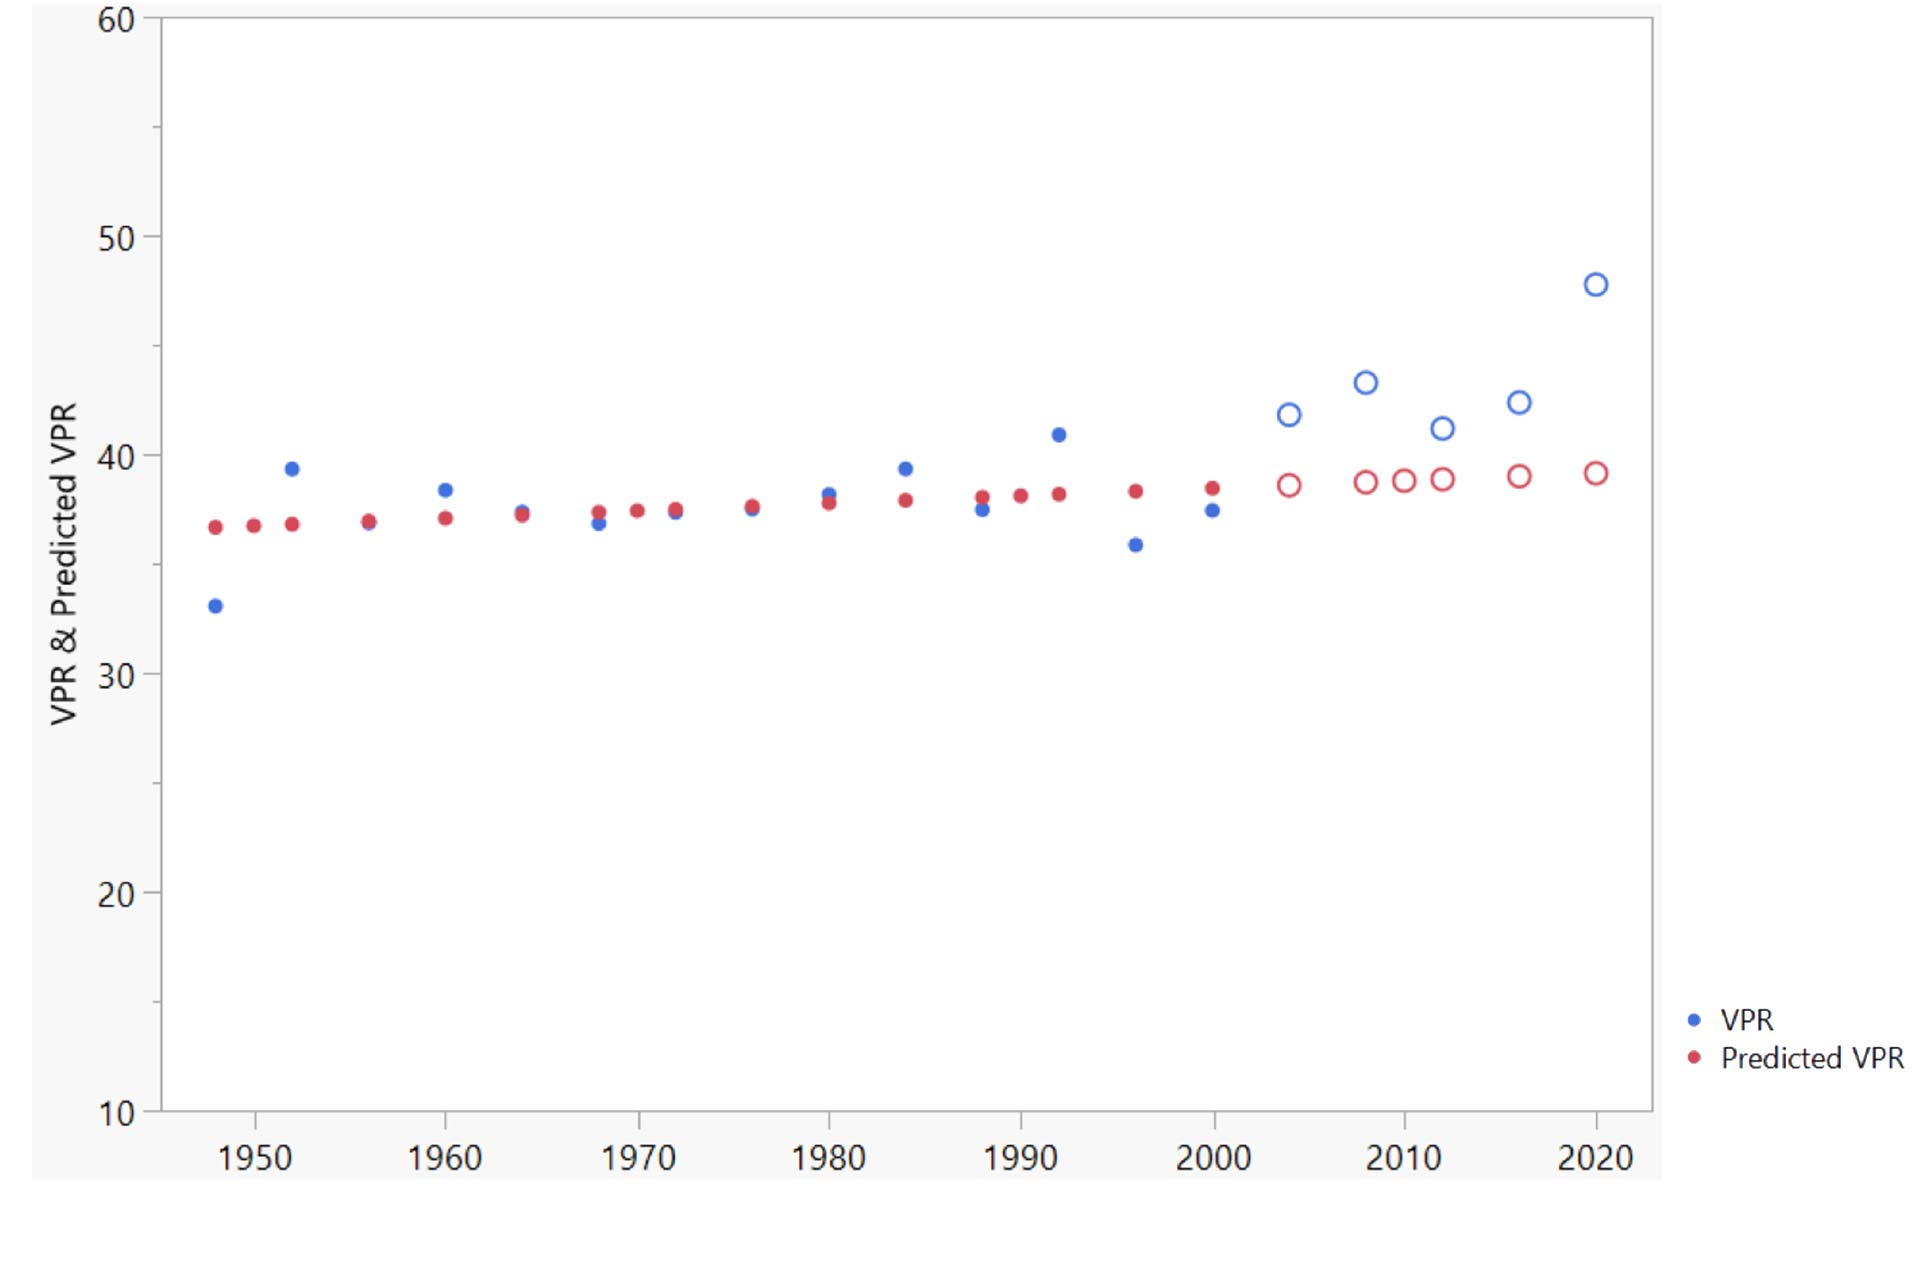
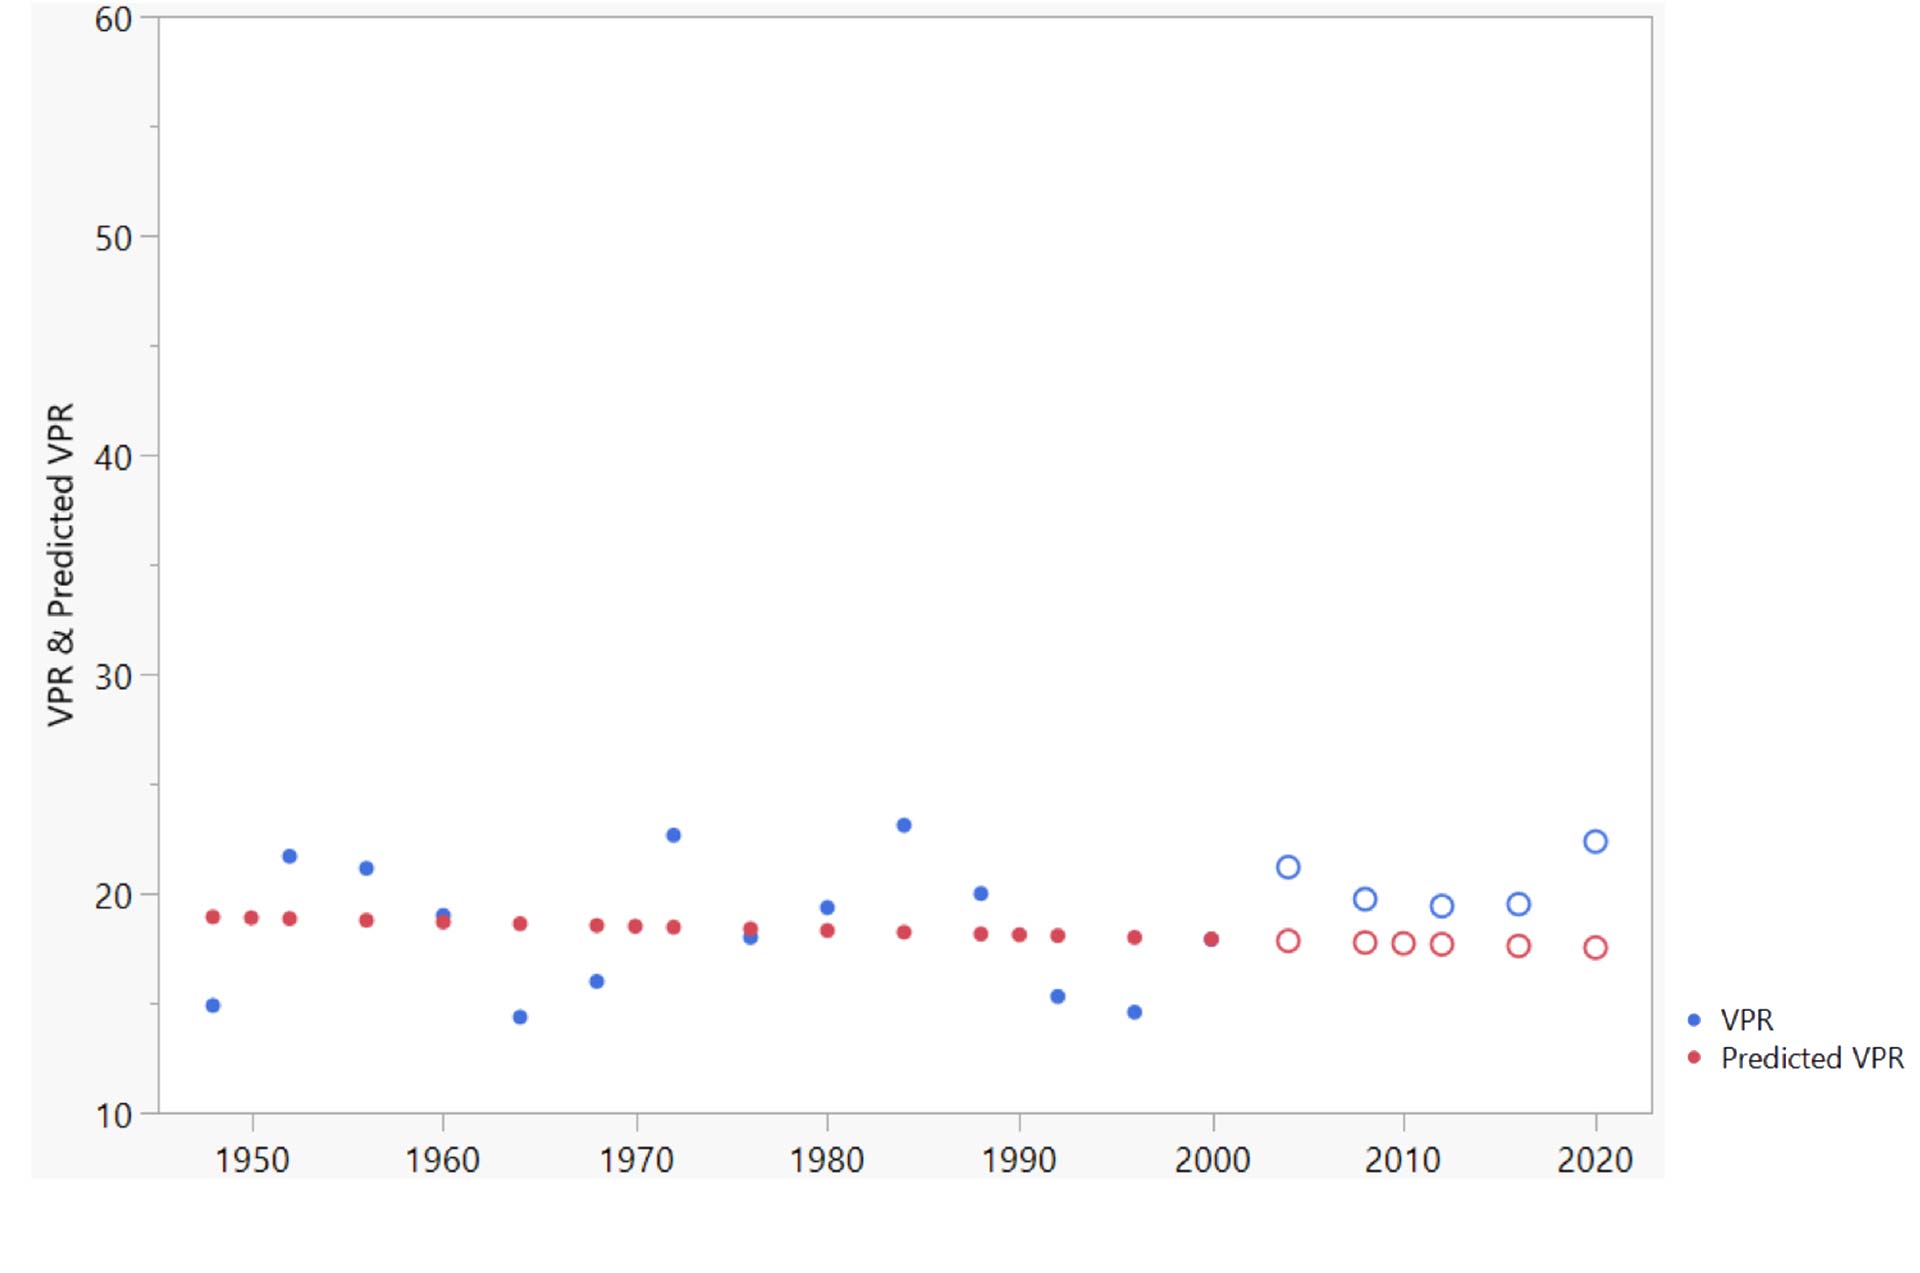
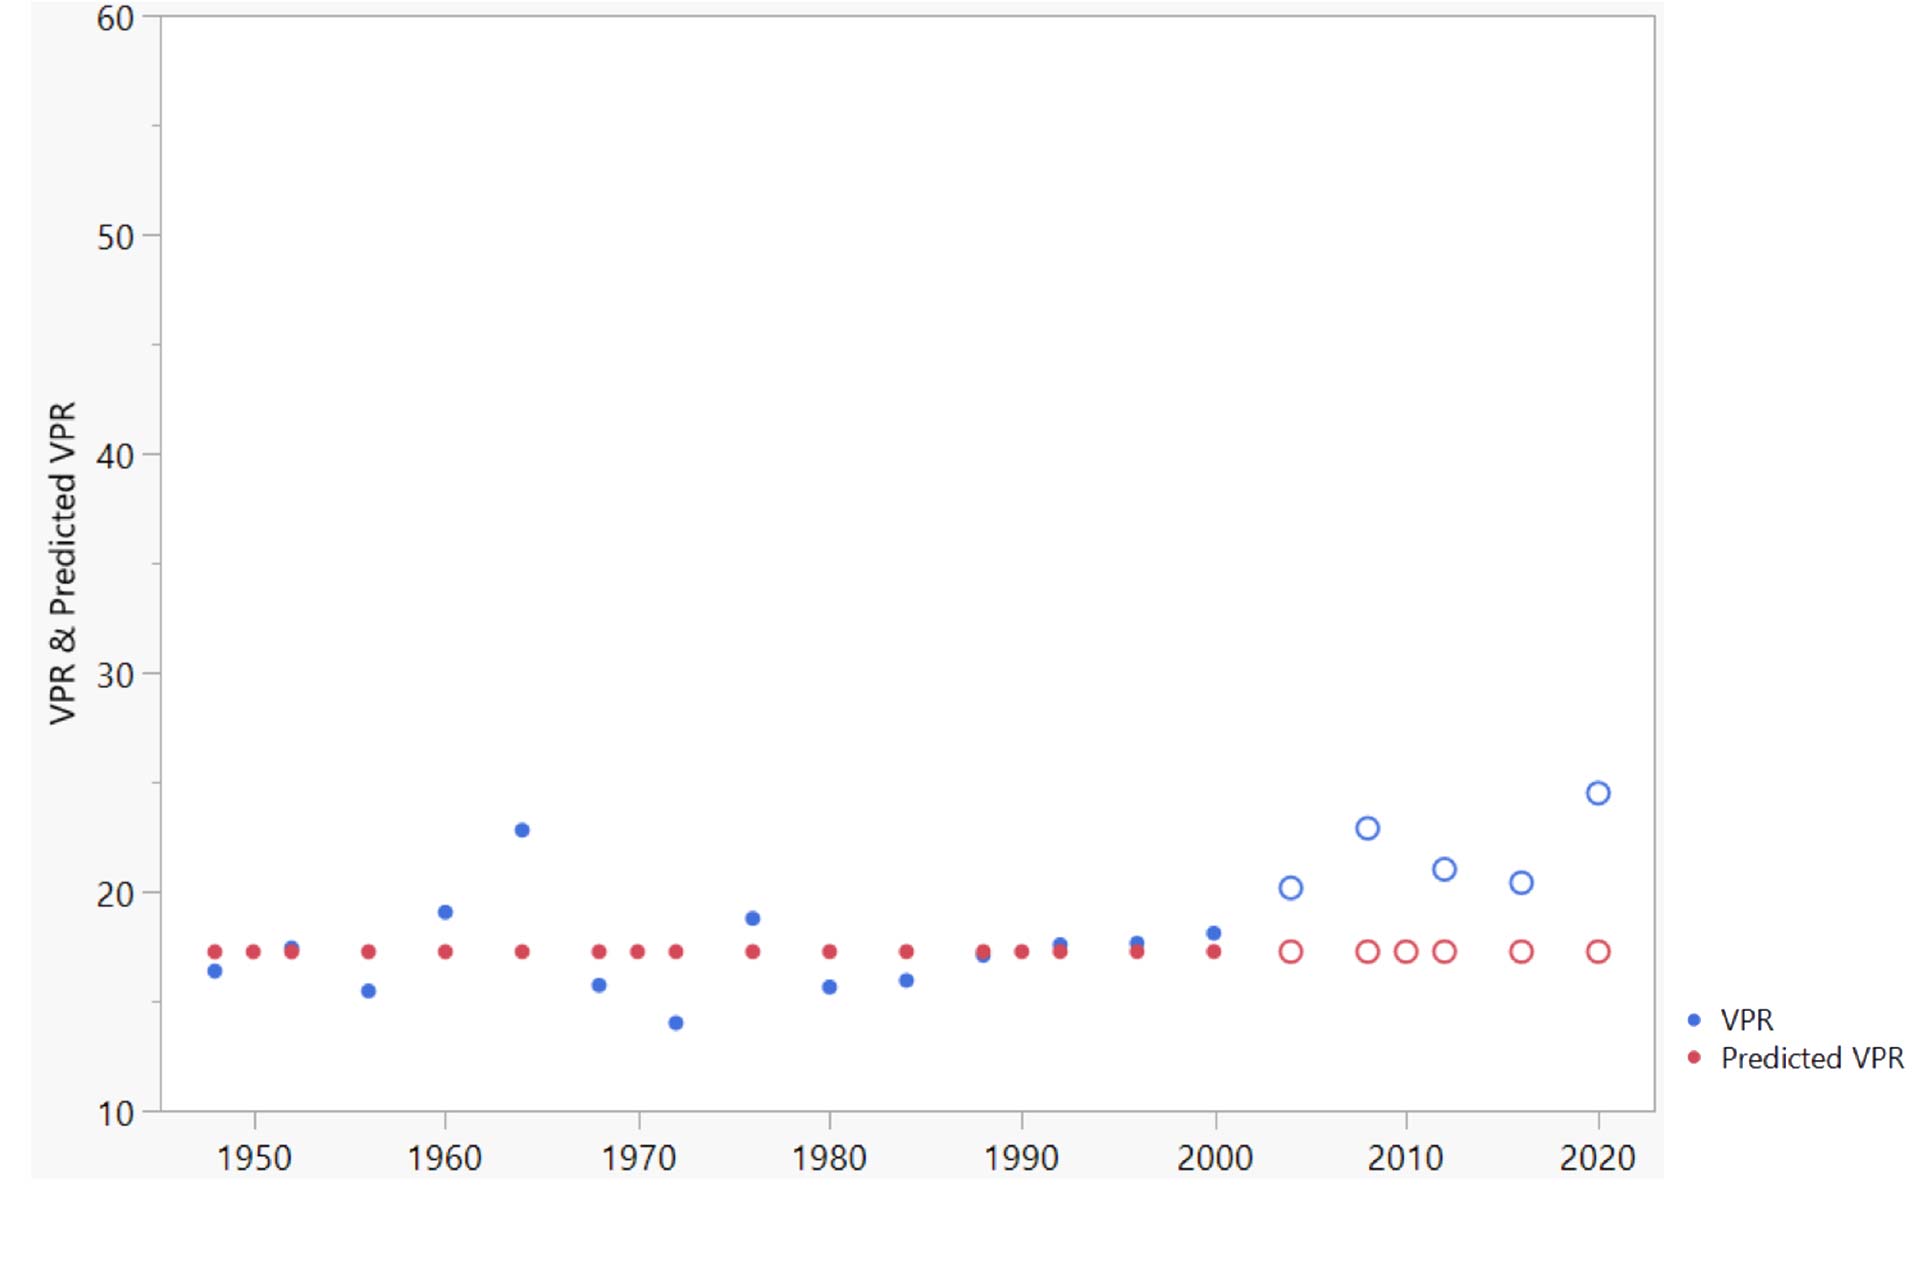
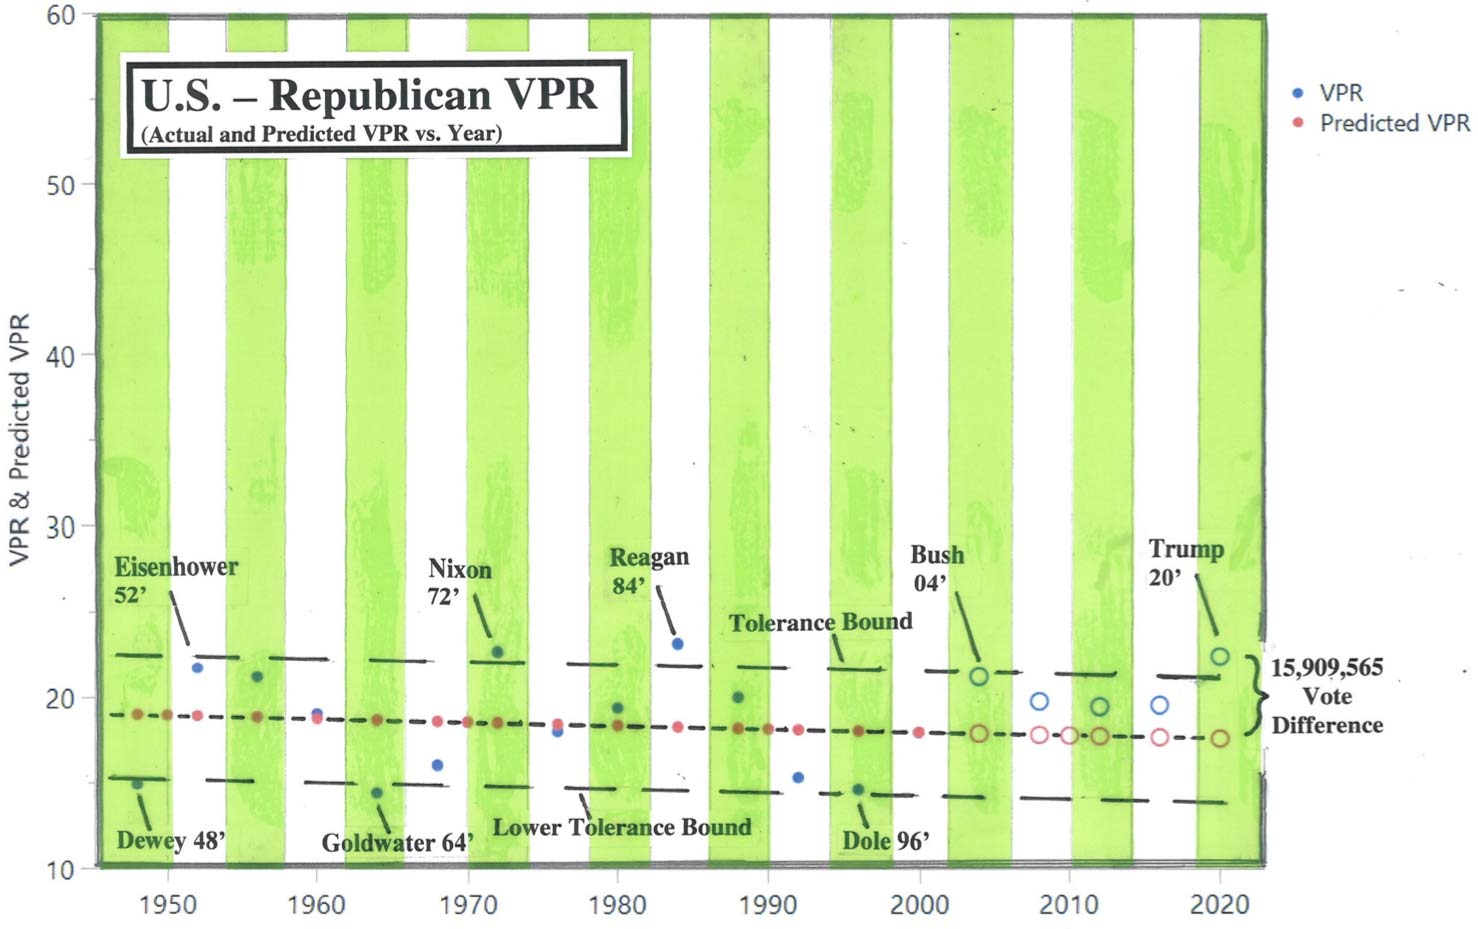
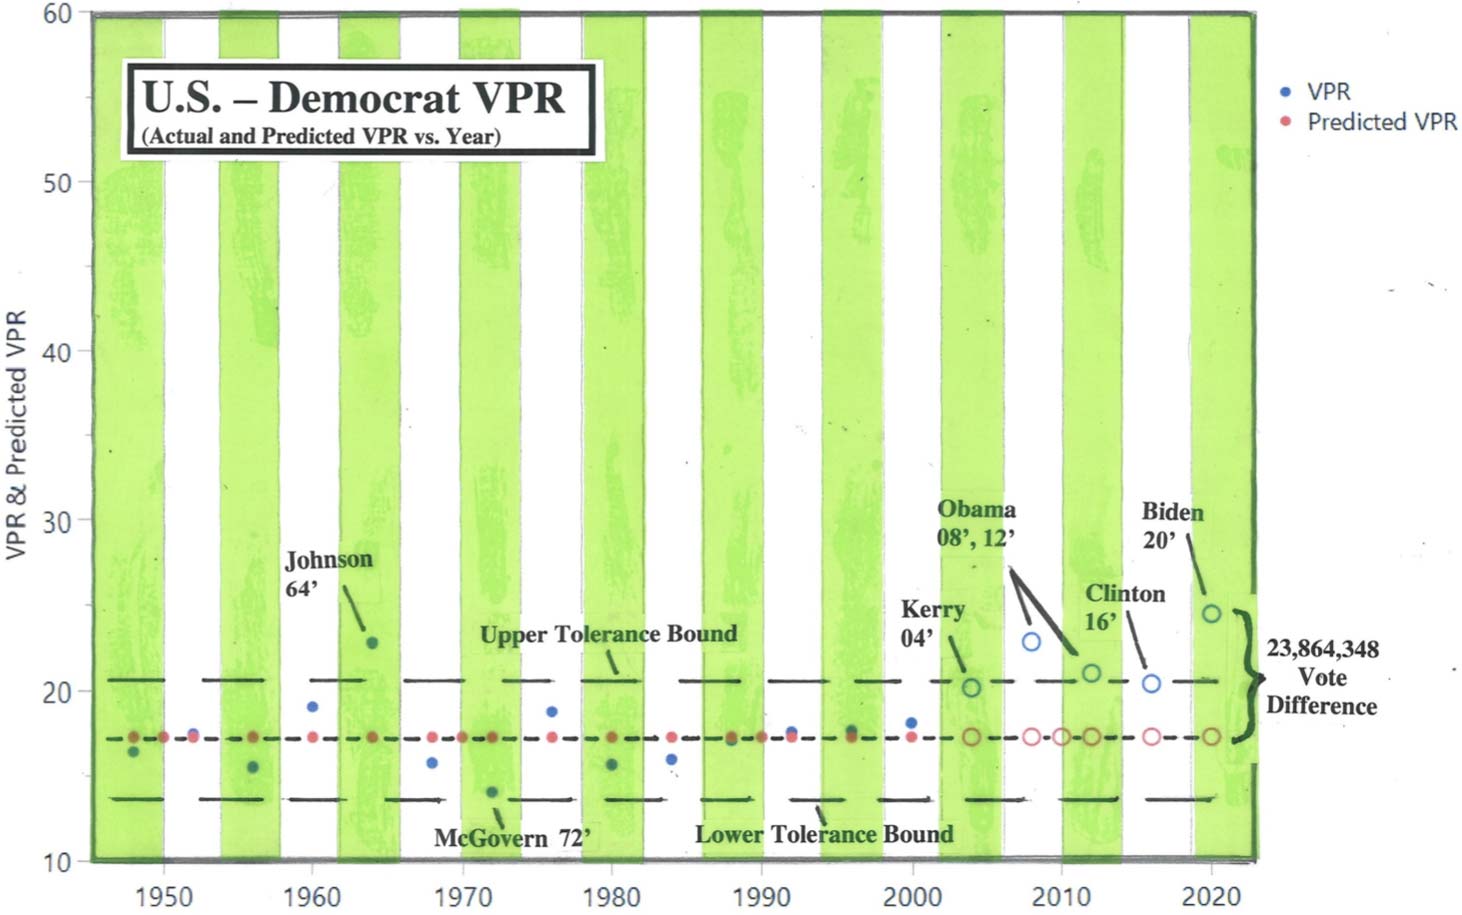
A slight (positive) incline long-term trend for the Total VPR; a slight (negative) decline for the Republican VPR; and a mostly even long-term trend for the Democrat VPR, with a breakout on the upside, for the Democrats starting in 2004. Most election results fall within the Tolerance Bounds up through the year of 2004.
The following is a brief analysis of all election cycles, involving the various regression charts:
1948 – With the race between Truman versus Dewey, Dewey performed poorly with a data point at or below the Lower Tolerance Bound (being a negative outlier) regarding the Republican VPR; but Truman performed only slightly better, being just below the trend line regarding his Democrat VPR. This was considered a lackluster election, and the Total VRP shows it, being at or below the Tolerance Bound (possibly considered even a negative outlier).
1952 – With the race between Eisenhower versus Stevenson, Eisenhower won with a landslide. Eisenhower did very well and was close to the Upper Tolerance Bound regarding the Republican VPR. Stevenson’s performance was average with his party VPR being at the trend line. Combined together, this resulted in the Total VPR being at the Upper Tolerance Bound, with a very high turnout rate.
1956 – With the rematch between Eisenhower versus Stevenson, Eisenhower won again in a landslide. Eisenhower was above the trend (again) with his party VPR; but this time, Stevenson performed below the trend line regarding his party VPR. With the Total VPR holding steady and being on the trend line, this suggest that some who voted Democrat in the previous election might have crossed over and voted Republican in this election cycle.
1960 – With race between Kennedy versus Nixon, it was a highly competitive one, being one of the closes races in history, on the national level and state after state. We see with the national charts that Kennedy performed well and was somewhat above the trend with his party VPR, but Nixon was barely able to get above his party VPR trend line. Combined together, this resulted in the Total VPR being above the trend line, with high voter turnout. There were, however, allegations of cheating in that election; we now have a methodology with the VPR regressions to further examine the vote at the state and county level.
1964 – With the race between L.B. Johnson and Goldwater, Johnson won by a landslide. While the Total VPR held steady on the trend line, we see a large movement, being outliers in fact, in the individual party VPRs. With one outlier seemingly offsetting the other in nearly equal proportions, this is an indication that people actually switched parties in their voting, to express their choice for a candidate – the political pendulum swung to the extreme Left, in favor of the Democrats for this cycle.
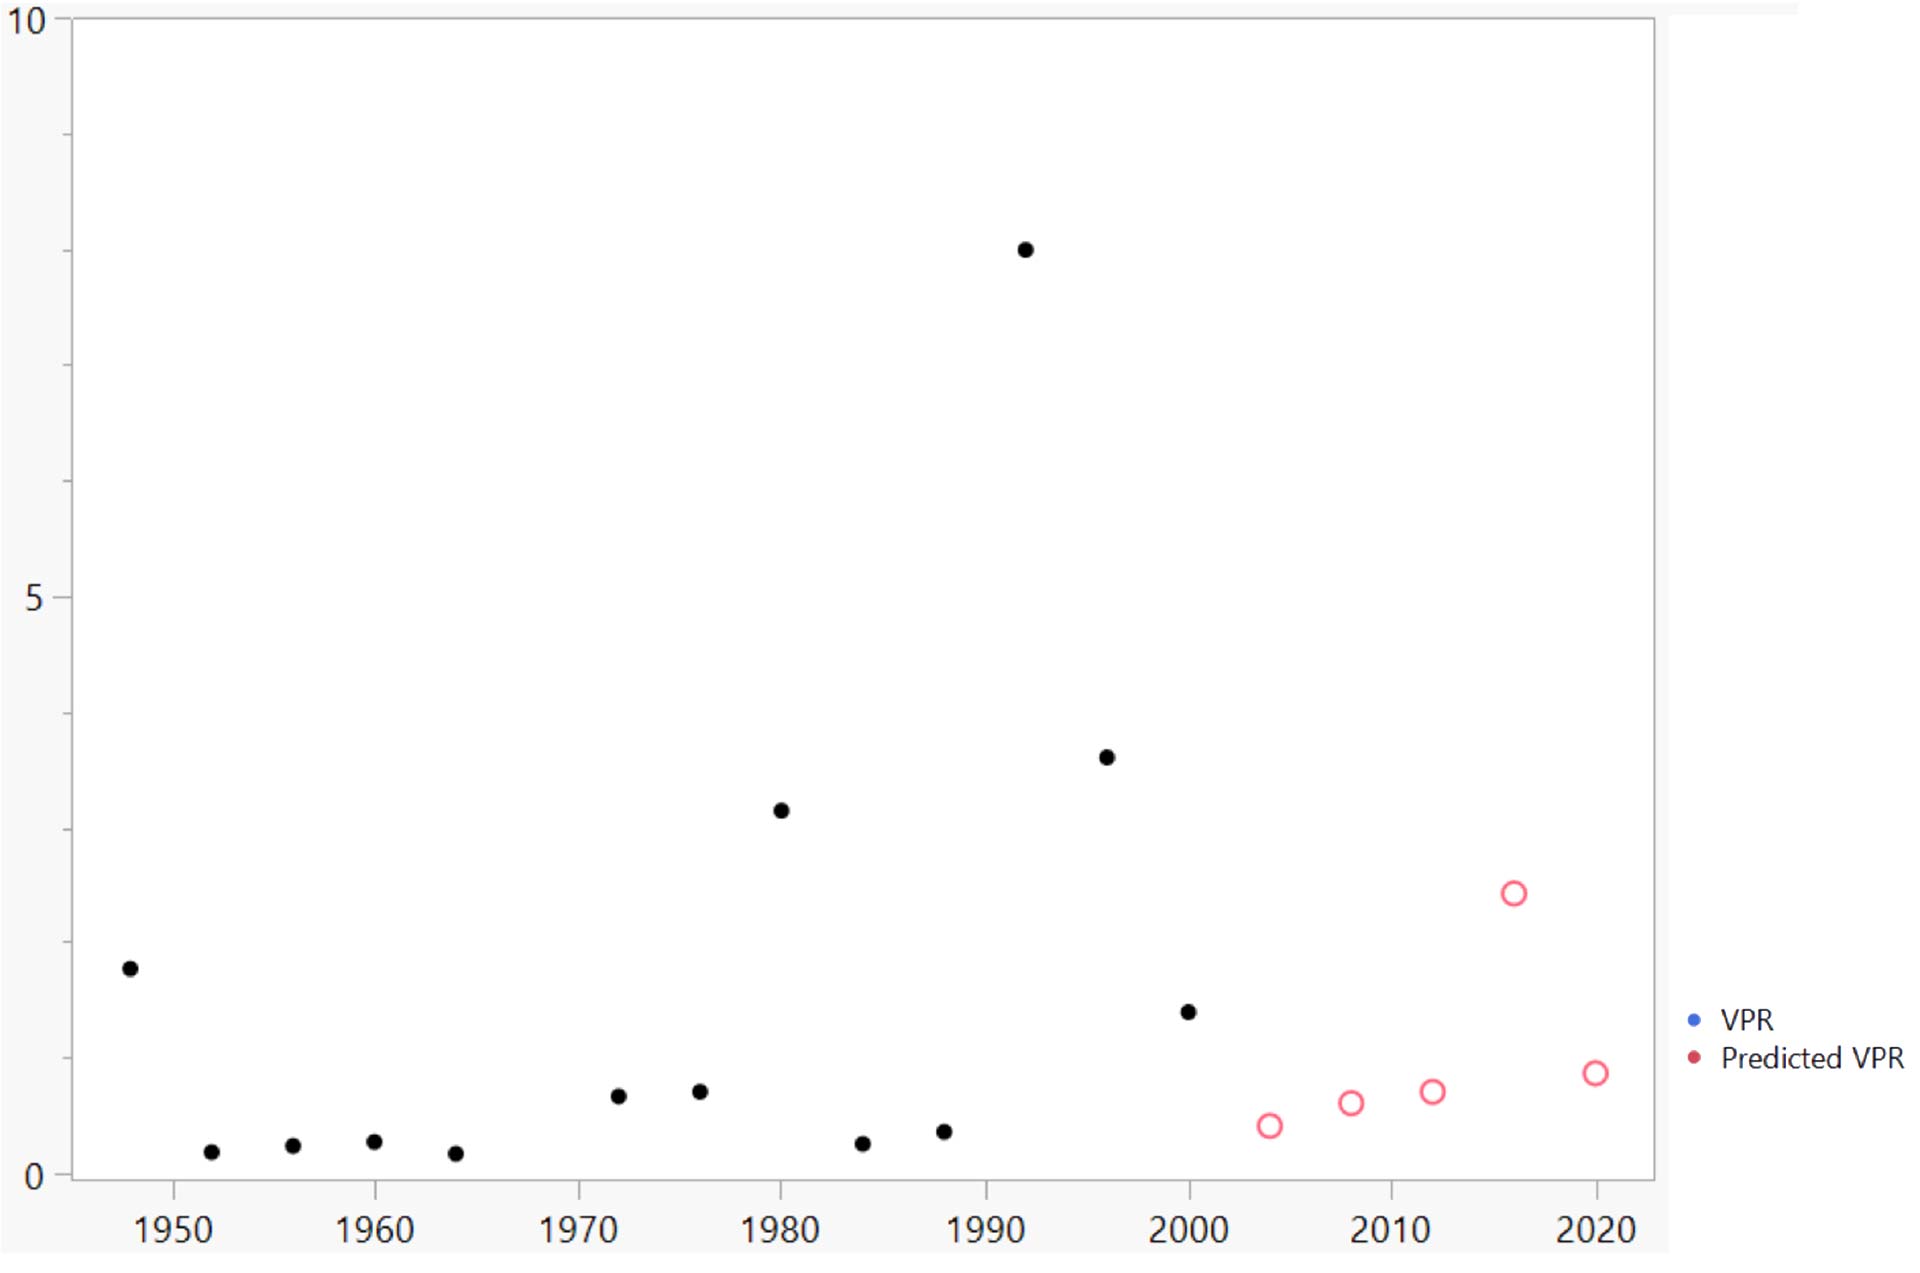
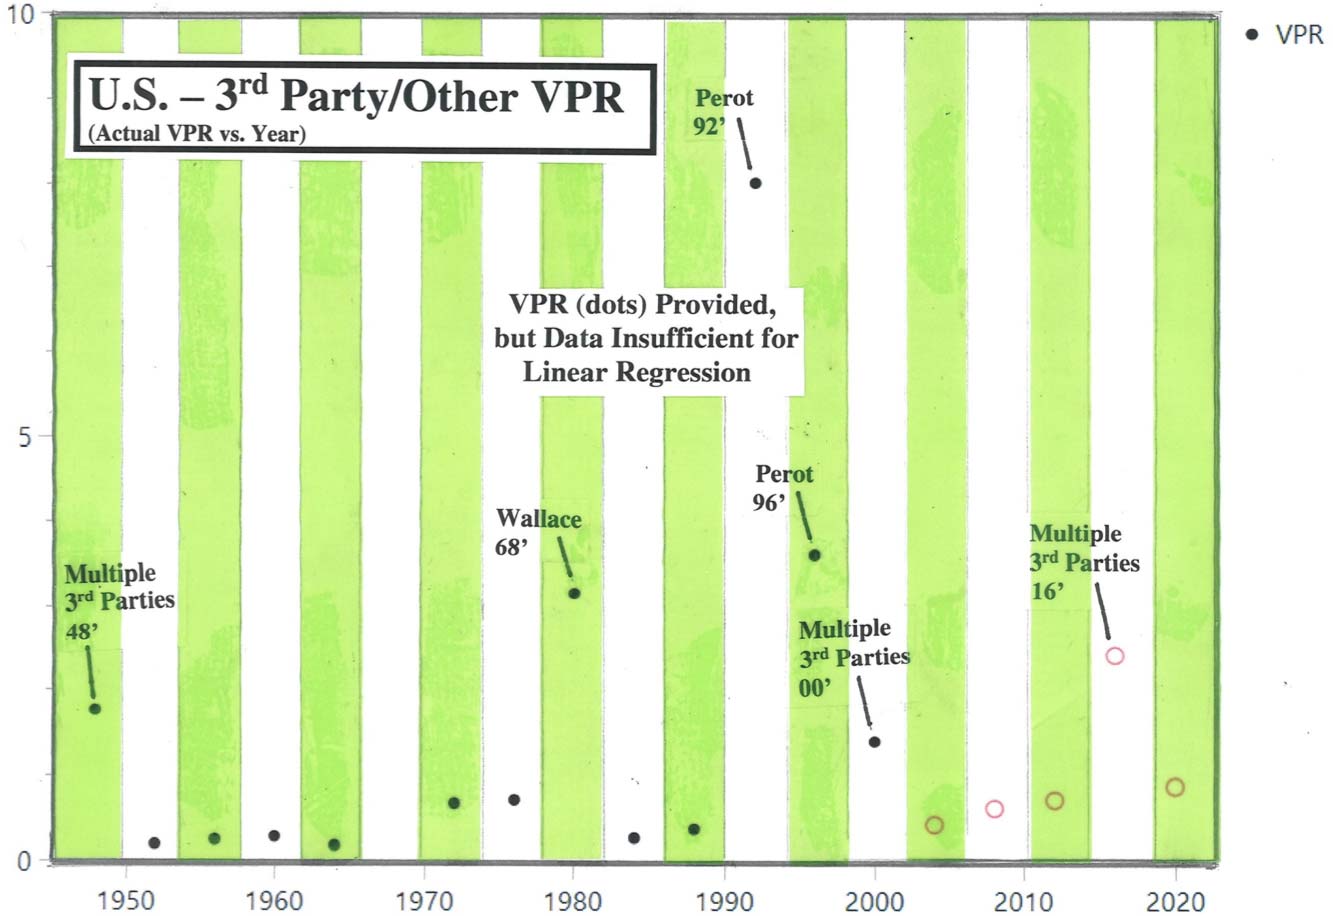
1968 – With a three man race between Nixon, Humphrey and Wallace, the VPRs for the two major parties were both below their trend line, but the VPR for the 3rd Party/Other category was unusually high, with 5.1% of the population voting for this category. Note the Total VPR was slightly below the trend line, even with three people running, indicating a slightly lower voter turnout. Wallace was considered the spoiler – taking more votes from the Democrats than the Republicans, allowing Nixon to win.
1972 – With the race between Nixon versus McGovern, Nixon won by a landslide. While the Total VPR held steady on the trend line, we see a large movement, at or beyond the Tolerance Bound, in the individual party VPRs. With one seemingly offsetting the other in nearly equal proportions, this is an indication that people actually switched parties in their voting, to express their choice for a candidate – the political pendulum swung to the extreme Right, in favor of the Republicans for this cycle.
1976 – Following Watergate, this was the race between Ford versus Carter, with Carter winning in a rather close race with small margins. Carter performed above-average with his party VPR; but Ford performed slightly below his party VPR trend. The Total VPR was on and in line with the trend with this election.
1980 – While this is considered a race between Reagan versus Carter, there was actually a 3rd Party contender (Anderson), who almost acted as a spoiler. Reagan performed slightly above his party VPR trend; and this was even with Anderson mainly taking votes away from the Republicans. Carter performed poorly and was below his party VPR trend. This would have been considered a landslide victory for Reagan, if it hadn’t been for Anderson.
1984 – With the race between Reagan versus Mondale, Reagan won by a landslide in his re-election bid; and this time, there were no major 3rd party candidates. Reagan was way above his party VPR trend line (an outlier), and Mondale was below his party VPR but within the Lower Tolerance Bound. With the Total VPR being above the trend line (suggesting a higher than normal turnout rate), there were likely some crossover votes from previously Democrat voters to support Reagan, but there also probably a good number of newly first-time voters who supported Reagan as well. The political pendulum swung to the extreme Right, in favor of the Republicans for this cycle.
1988 – With the race between Bush Sr. versus Dukakis, Bush won, but not at the same level as his predecessor did, which is indicated with the party VPR compared to the trend line. Dukakis was slightly below his party VPR trend. Combine together, the Total VPR was slightly below the trend line for this election cycle.
1992 – With a three man race between Bush Sr., Clinton and Perot, Bill Clinton won the race – perhaps as the result of Ross Perot acting as a spoiler. Clinton was ever so slightly above his party VPR, but Bush was significantly below his party VPR trend. And Perot captured the highest level, in the modern political era, for a 3rd Party candidate, with the VPR for this category reaching 8% of the total population. While Perot arguably took votes mainly away from the Republicans, he also invigorated the campaign with getting more Americans to participate in the election process for the first time – with the Total VPR reaching a historic high, at or above the Upper Tolerance Bound.
1996 – Again, this was a three man race, but this time involving Clinton, Perot and Dole – with Clinton winning a second term. Dole was way below his party VPR trend, being at the Lower Tolerance Bound. Clinton again was ever so slightly above his party VPR. Perot’s support, however, as a major 3rd party candidate was waning, with his support roughly half of what it was before. This election cycle was generally considered a lackluster election, with the Total VPR being significantly below the long-term trend line.
2000 – With the race mainly between Bush Jr. versus Gore, it was a bit unusual, indeed. Gore won the popular vote and Bush won the Electoral College – with Florida ending in a tie and the U.S. Supreme Court breaking the tie. With the VPR charts, we see that Gore was slightly above his party trend, and Bush was right on his trend line. The 3rd Party/Other category was ever-so slightly above normal, with 1.4% (over the 1% threshold) of the population voting for this category. The Total VPR was slightly below the trend, indicating possibly a slightly below normal voter turnout for this cycle.
2004 – Following the 9/11 terrorist attacks, this was a race between Bush versus Kerry – with Bush winning a second term. This election cycle was a bit unusual with the VPRs of both major political parties being significantly above their trend line (at their Upper Tolerance Bound in fact), indicating very few crossover voters switching parties, but rather a slew of new voters participating in the election process. This resulted in the Total VPR being at the Upper Tolerance Bound as well. The unusualness of this election might warrant further investigation – possibly a study of the VPRs in terms of a regression analysis at the individual state and/or county level.
2008 – With the race between Obama versus McCain, Obama won with a major victory, and the election represents an Outlier for both the Total VPR and the Democrat VPR. McCain did fair also with his party VPR being above trend. Most outliers have easy explanations; and with Obama being the “First Black President” and attracting an increase turnout level by the Black population, this is likely the explanation for this outlier for this election cycle.
2012 – With the race between Obama versus Romney, Obama won his re-election bid. While Obama did win, his level of support was waning which is expressed with both his party VPR and the Total VPR, with neither being outliers as before on the national level. Romney might have actually done a bit better than what he was given credit for – with his data point being slightly above his party VPR trend. Again, the Total VPR was likely above normal levels because of Obama’s increase turnout level with the Black population.
2016 – With the race between Trump versus Clinton, Trump was the (outside) victor. It might have been the result of the 3rd Party/Other category, involving multiple number of parties, reaching the unusually high level of 2.13% of the total population, but this was again a situation where one candidate (Clinton) won the popular vote, and the other candidate (Trump) won the Electoral College. This election cycle was a bit unusual with the VPRs of both major parties being significantly above their respective trend lines, with the Democrats actually being at their Upper Tolerance Bound. Combine together along with the higher than expected 3rd Party/Other vote, this apparently made for a Total VPR also being at the Upper Tolerance Bound. A further investigation into the unusualness of this election might be warranted.
2020 – With the race between Trump versus Biden, there is no easy explanation for this cycle being an Outlier – a very unusual situation. While Trump is an outlier with his party VPR, he is actually within the historical context of his party’s level of voting, similar to the levels that Nixon in 72’ and Reagan in 84’ reached. Biden, on the other hand, reaches the highest level ever for his party’s VPR on a national level. Very unusual and without much explanation. Combined together, the Total VPR reach astronomical levels. Furthermore, the Out-of-Line bloc of votes was significant with the national number for the Total VPR being a staggering 28.6 Million. It should be obvious that this election cycle warrants a further investigation, base on this regression analysis.
In cycles where this is greater than 1% of the population, it generally creates havoc for the two major parties – often resulting with one party winning the popular vote and the other winning the Electoral College.
Because the 3rd Party vote is usually at or very close to zero, the Data for this section is Insufficient for Linear Regression Analysis.